The end of Sprint #4
Here we are again.. the end of Sprint 4! This incredibly short sprint lasted only 7 days. Kingsday was included here, but Nikki, Michelle and I also had to work on our thesis on Fridays. But now we are at the weekend before the peer pitch. Since Monday and Tuesday are holiday’s, we’ll start next week with Peer pitch #4! In this blogpost we’ll catch you up with everything we did in last few weeks.
The week of april 20-24
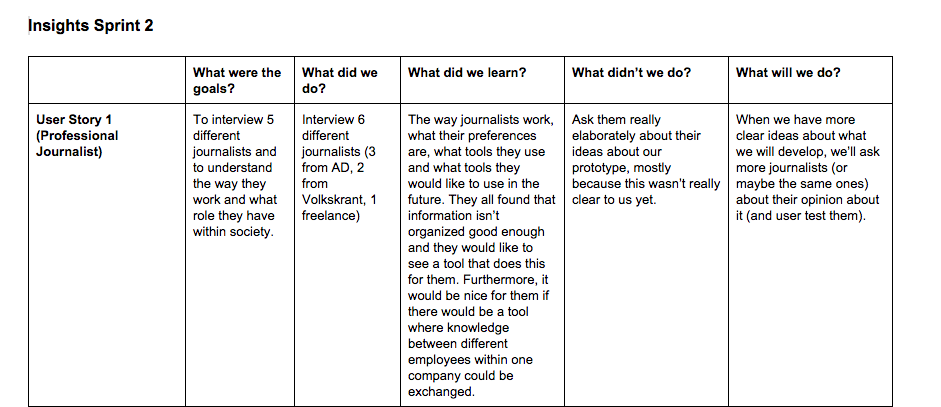
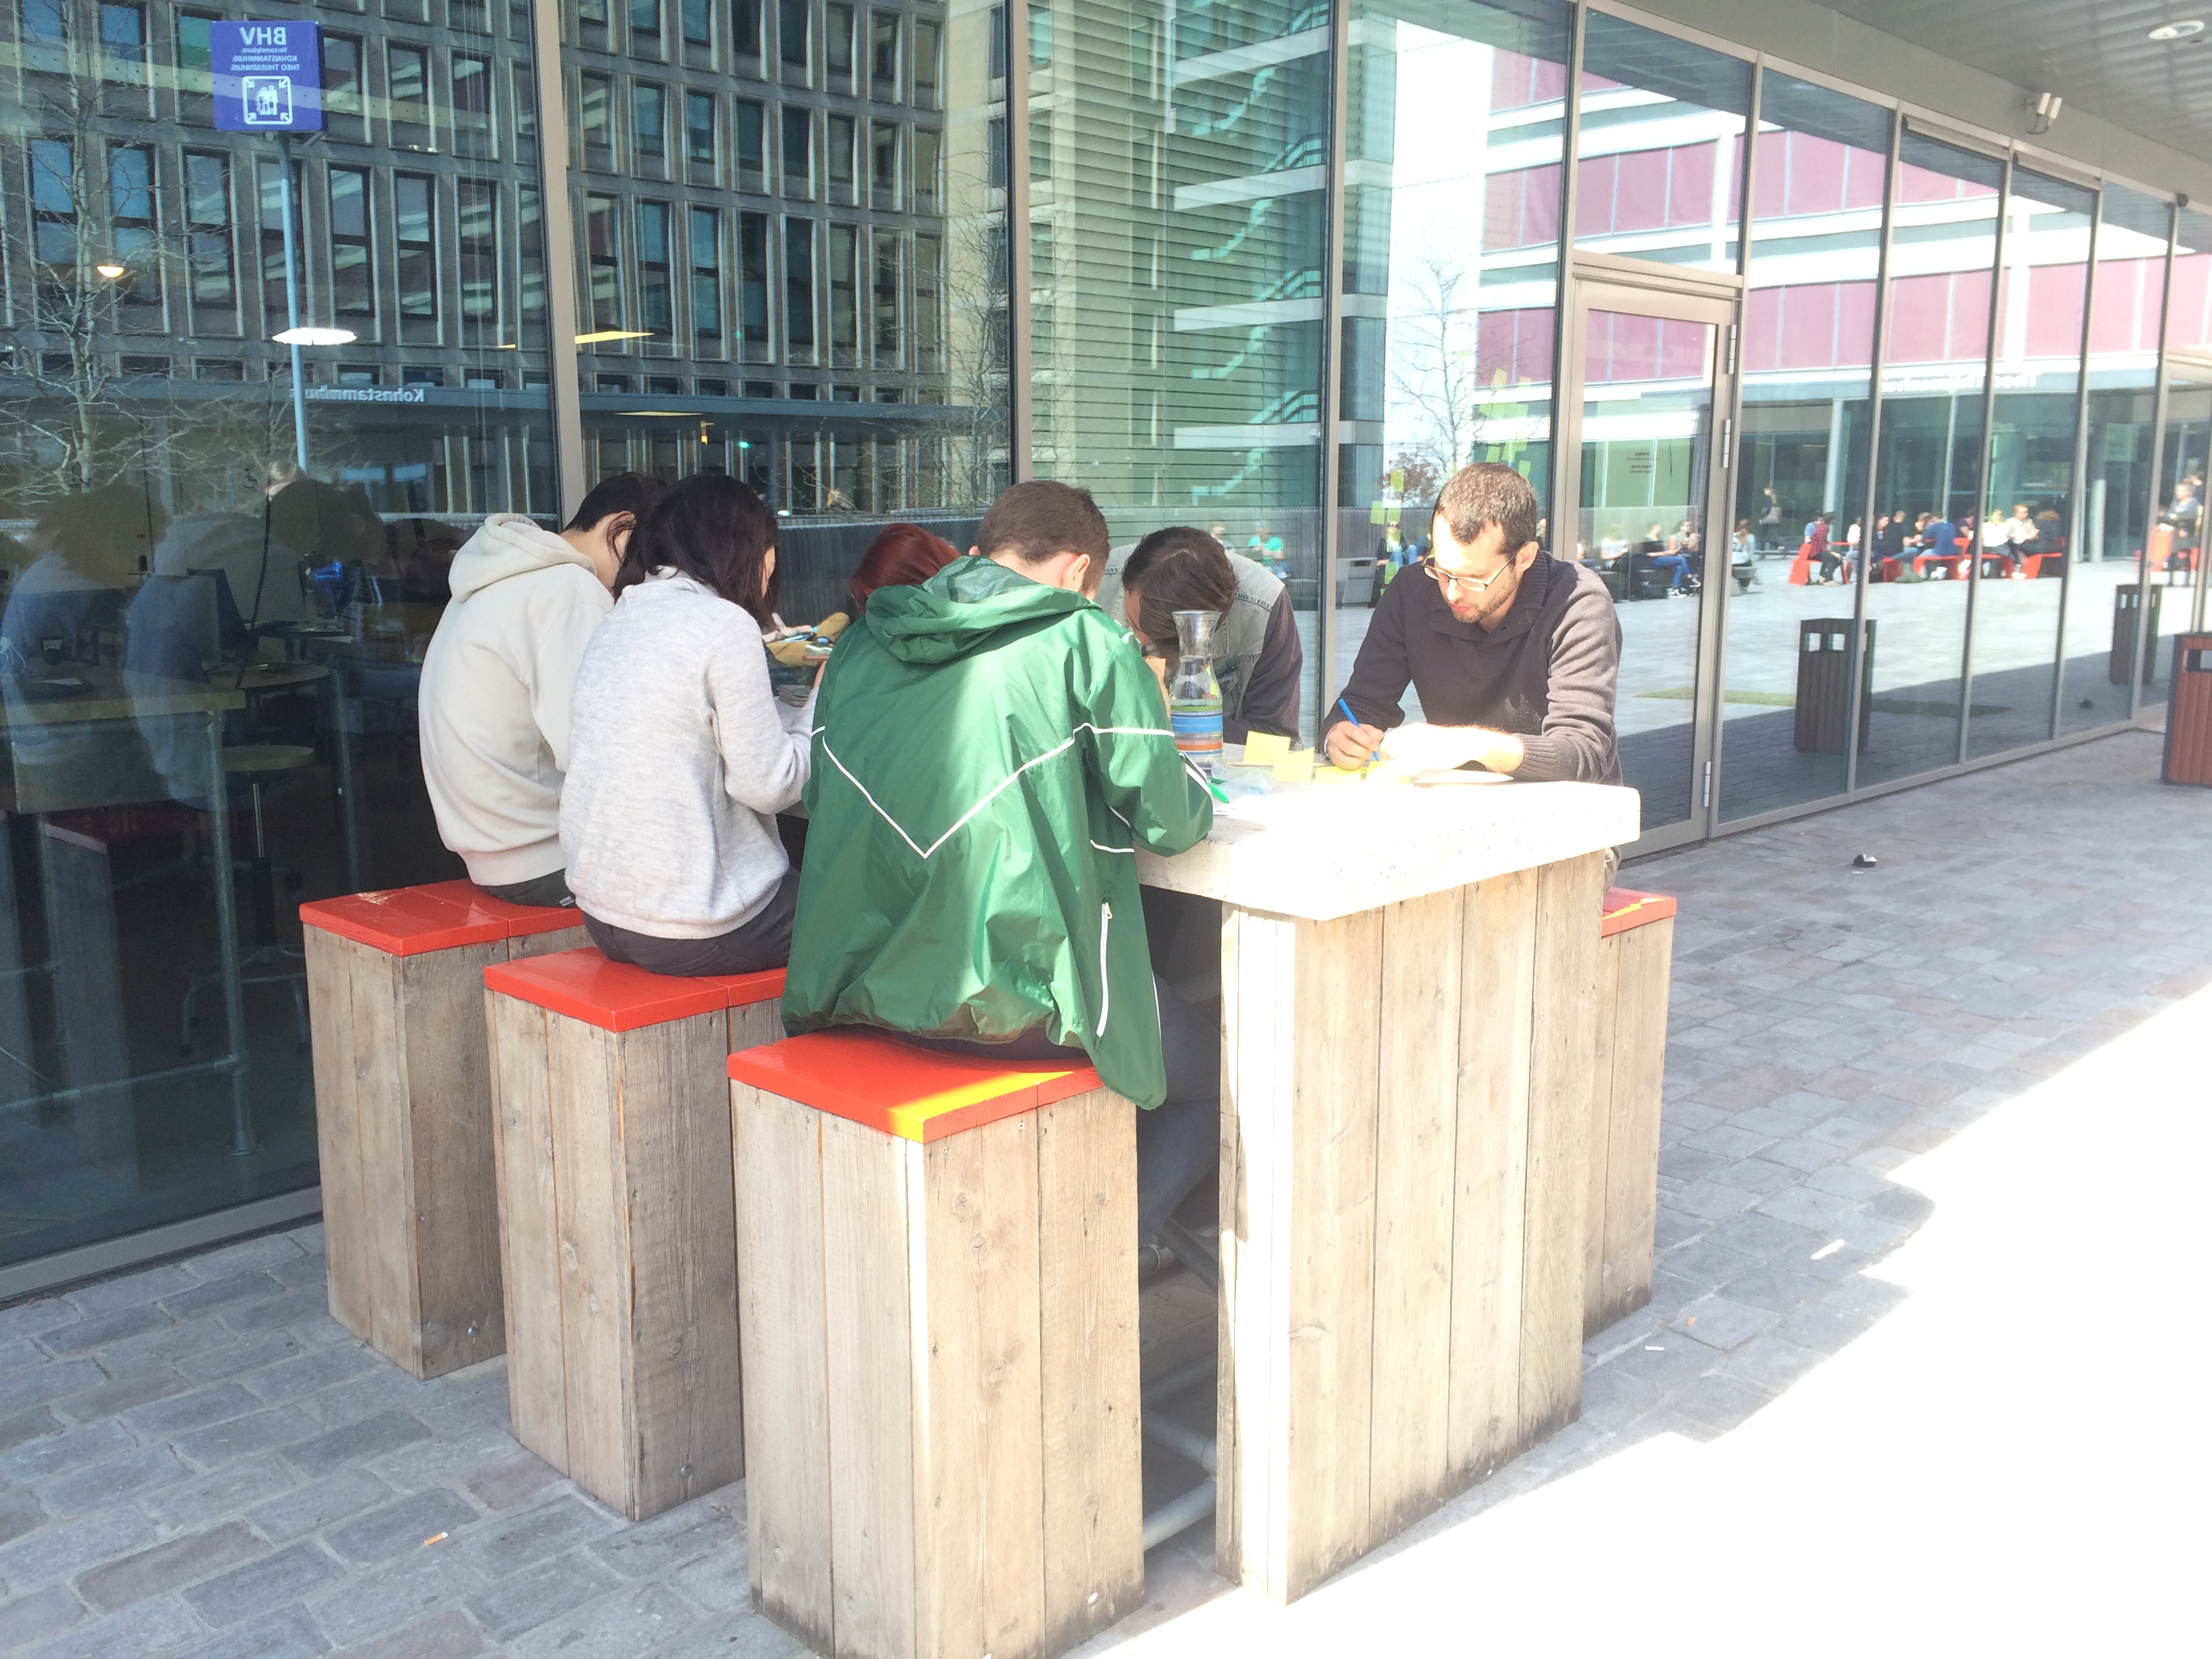
We started Monday the 20th of april with a sprint planning session. Together with the team, we came up with six different user stories, while we planned the sprint. You can see them below:
User Stories Sprint 4
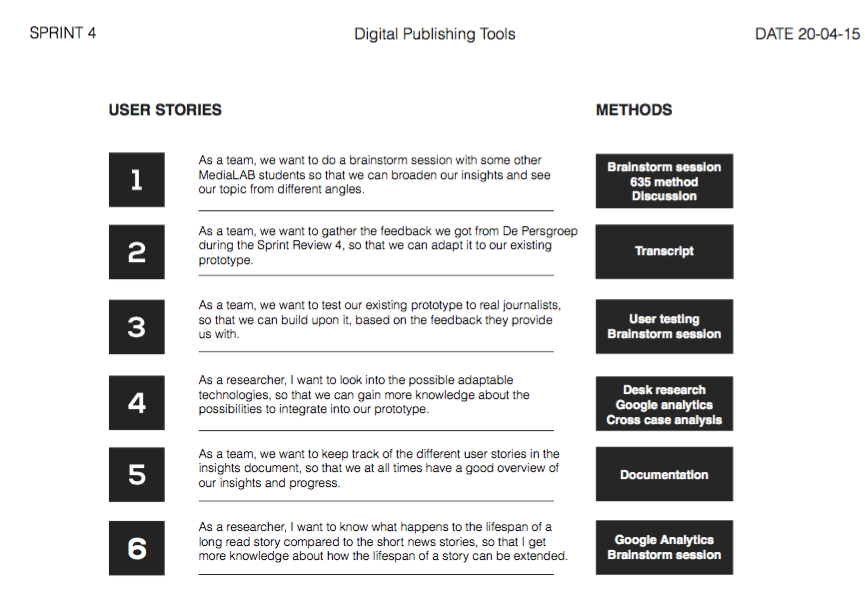
After the sprint planning session, that had been a while because all of the holidays we had in between. The Glass-kit team had to prepare it and it was nice to catch up with everyone!
MediaLAB Lunch
In the evening, we had dinner at Geflipt with our team. It was really nice to be with our team and our coach Margreet in another environment than MediaLAB.
On Tuesday, we had a brainstorm session with some other MediaLAB students. Since the weather was good, we decided to do it outside. This was the result:
MediaLAB Brainstorm
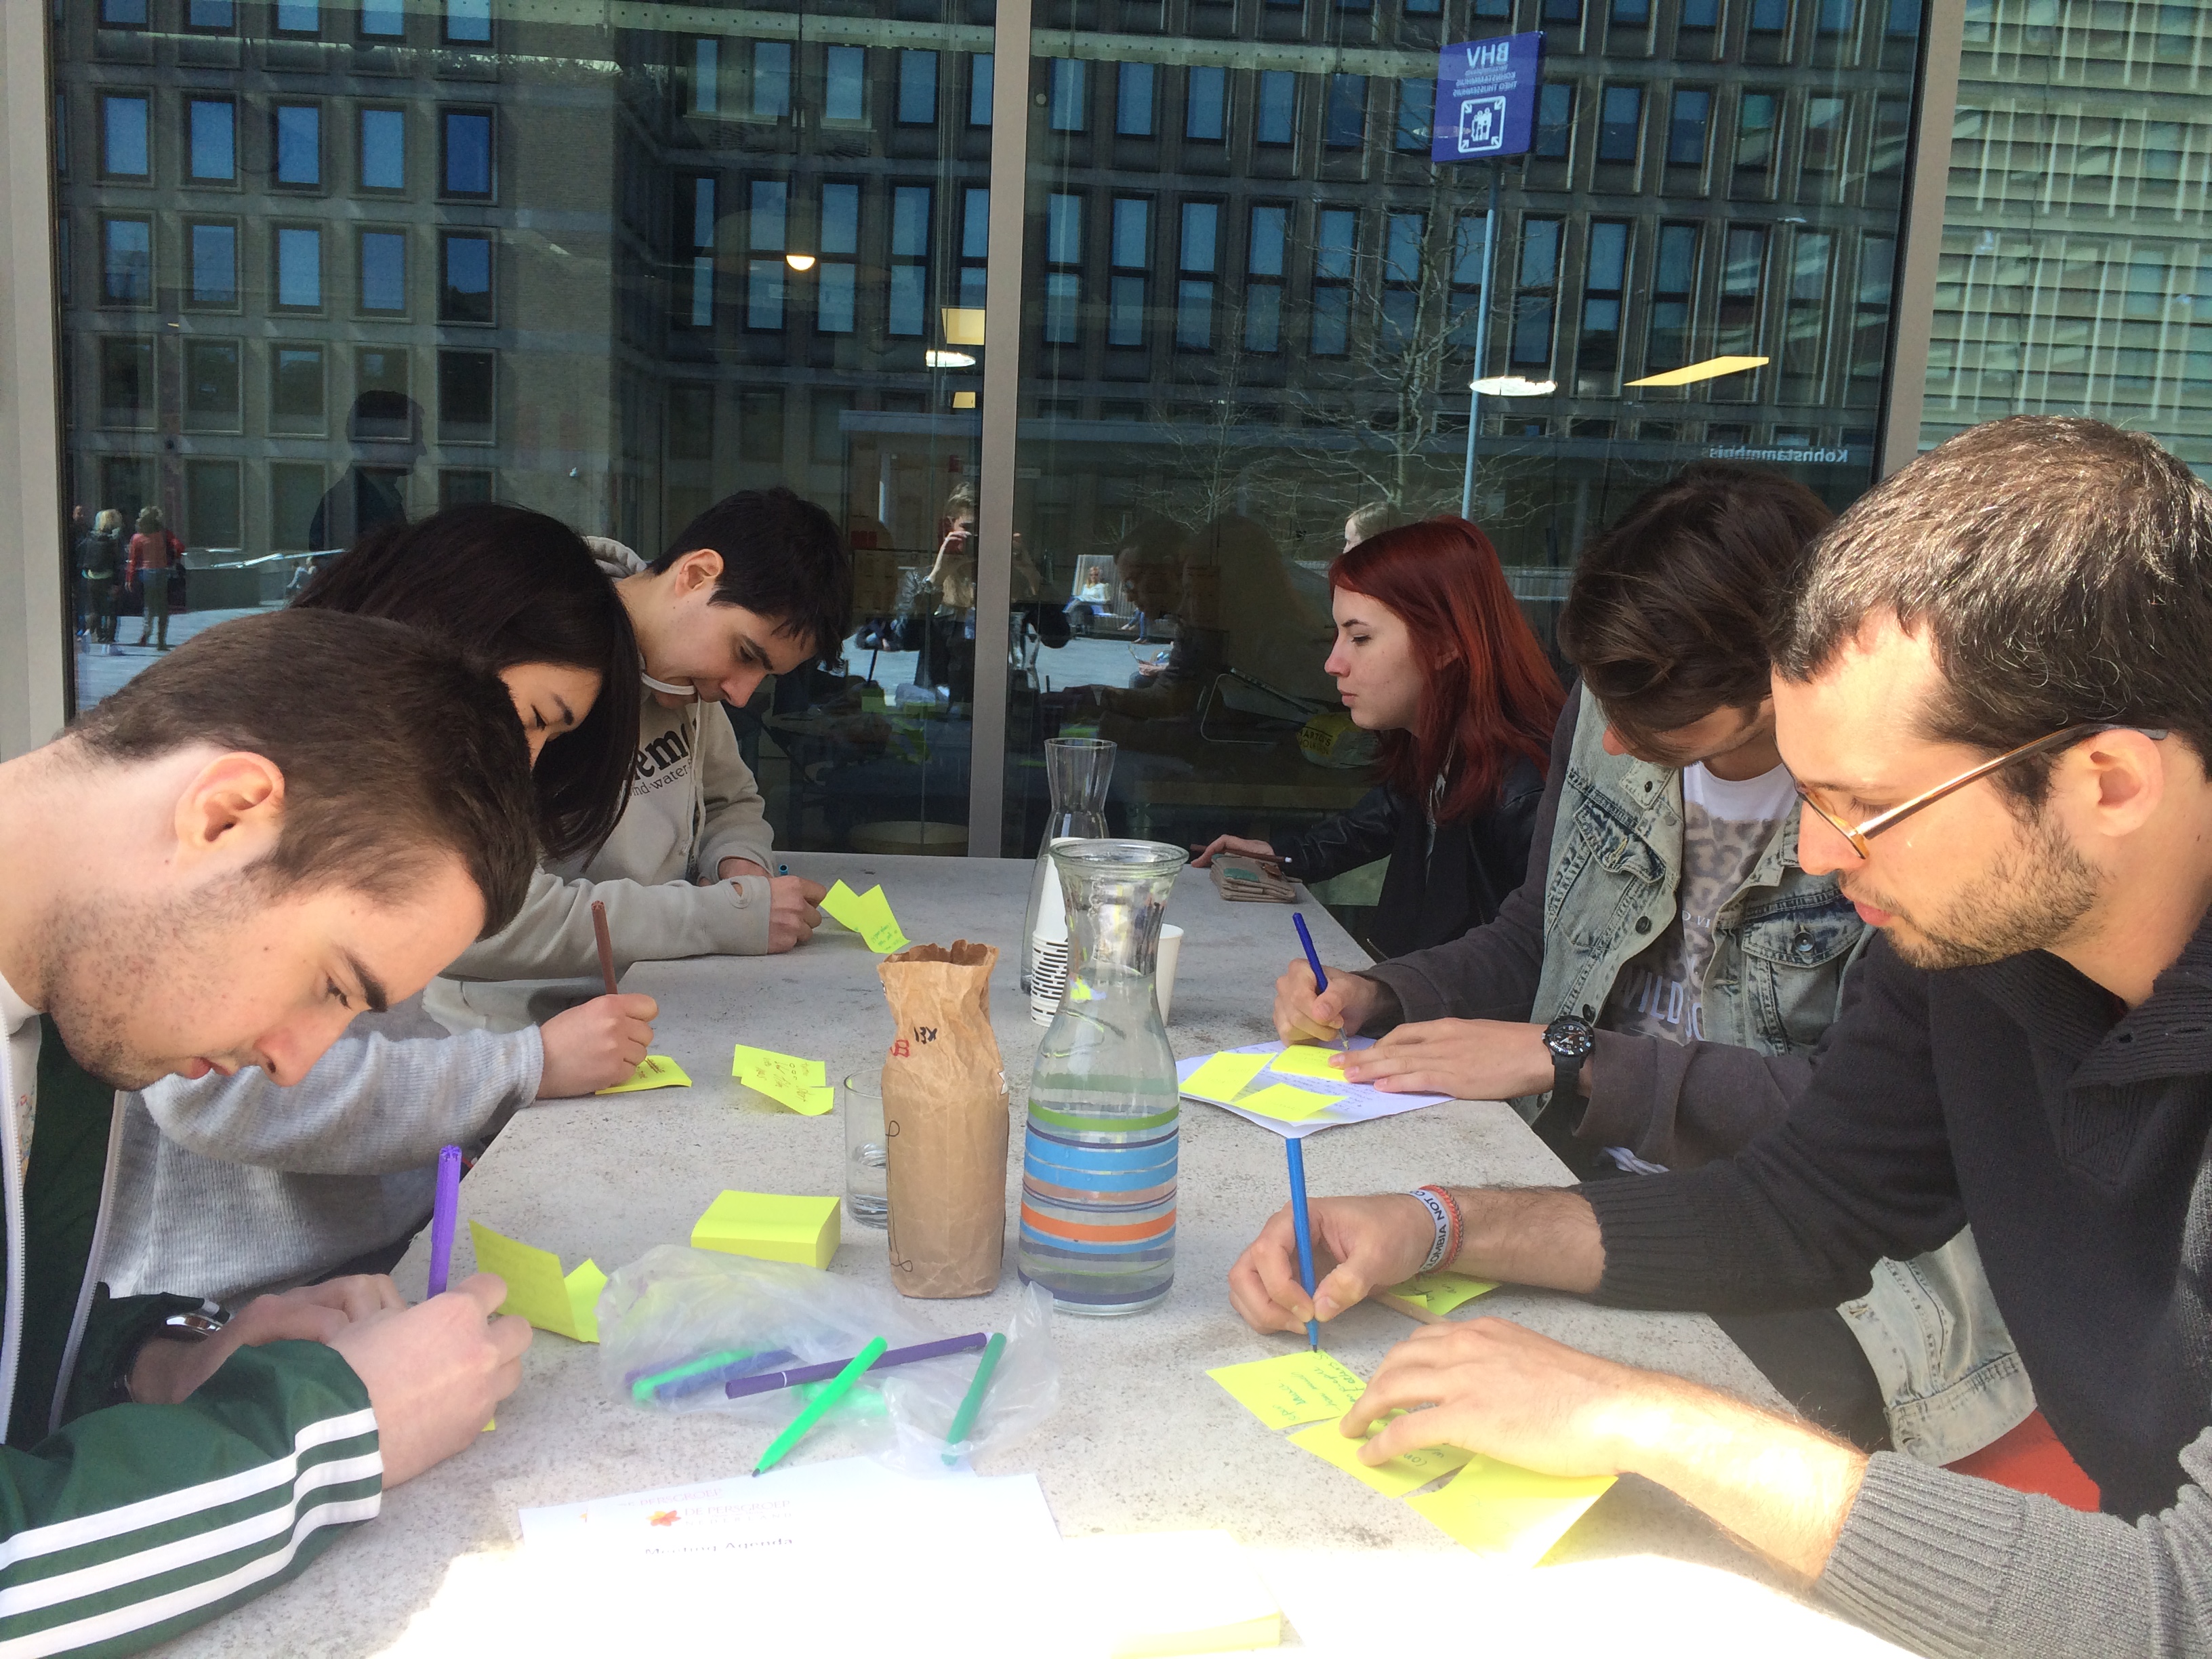
MediaLAB Brainstorm
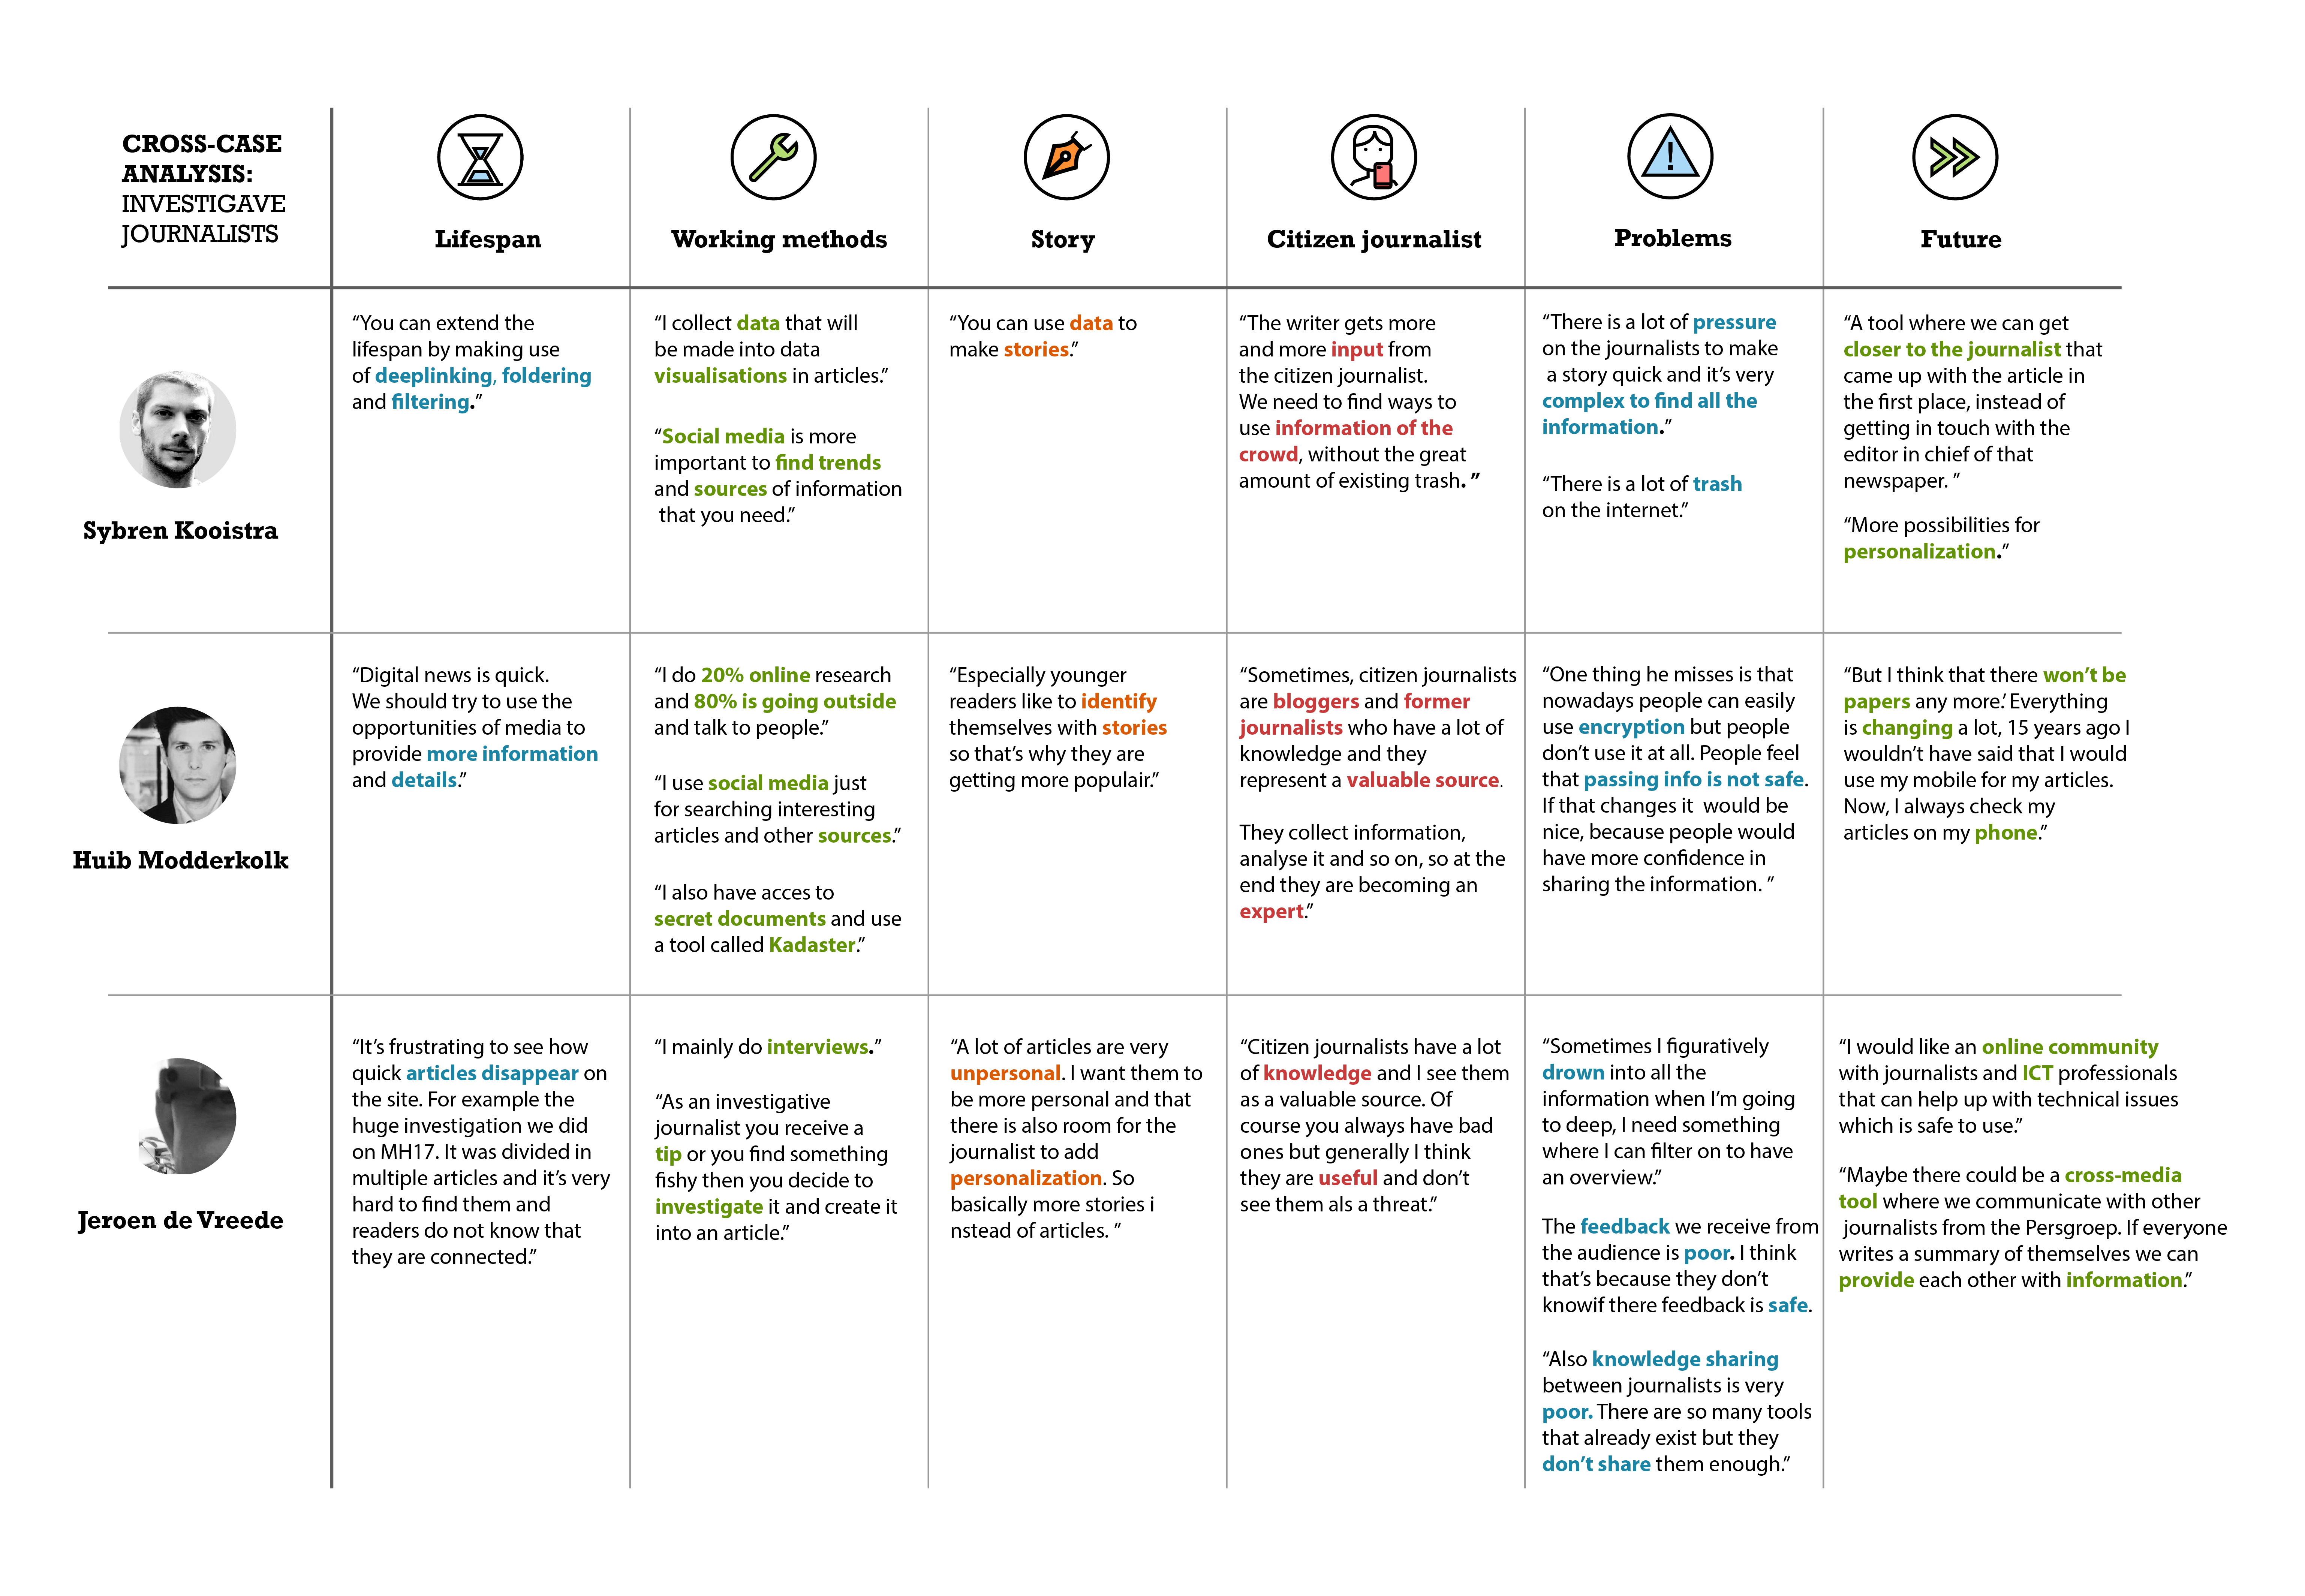
In the afternoon, we worked out all the ideas of the brainstorm session. It turned out we could divide the ideas of the group in six bigger themes.
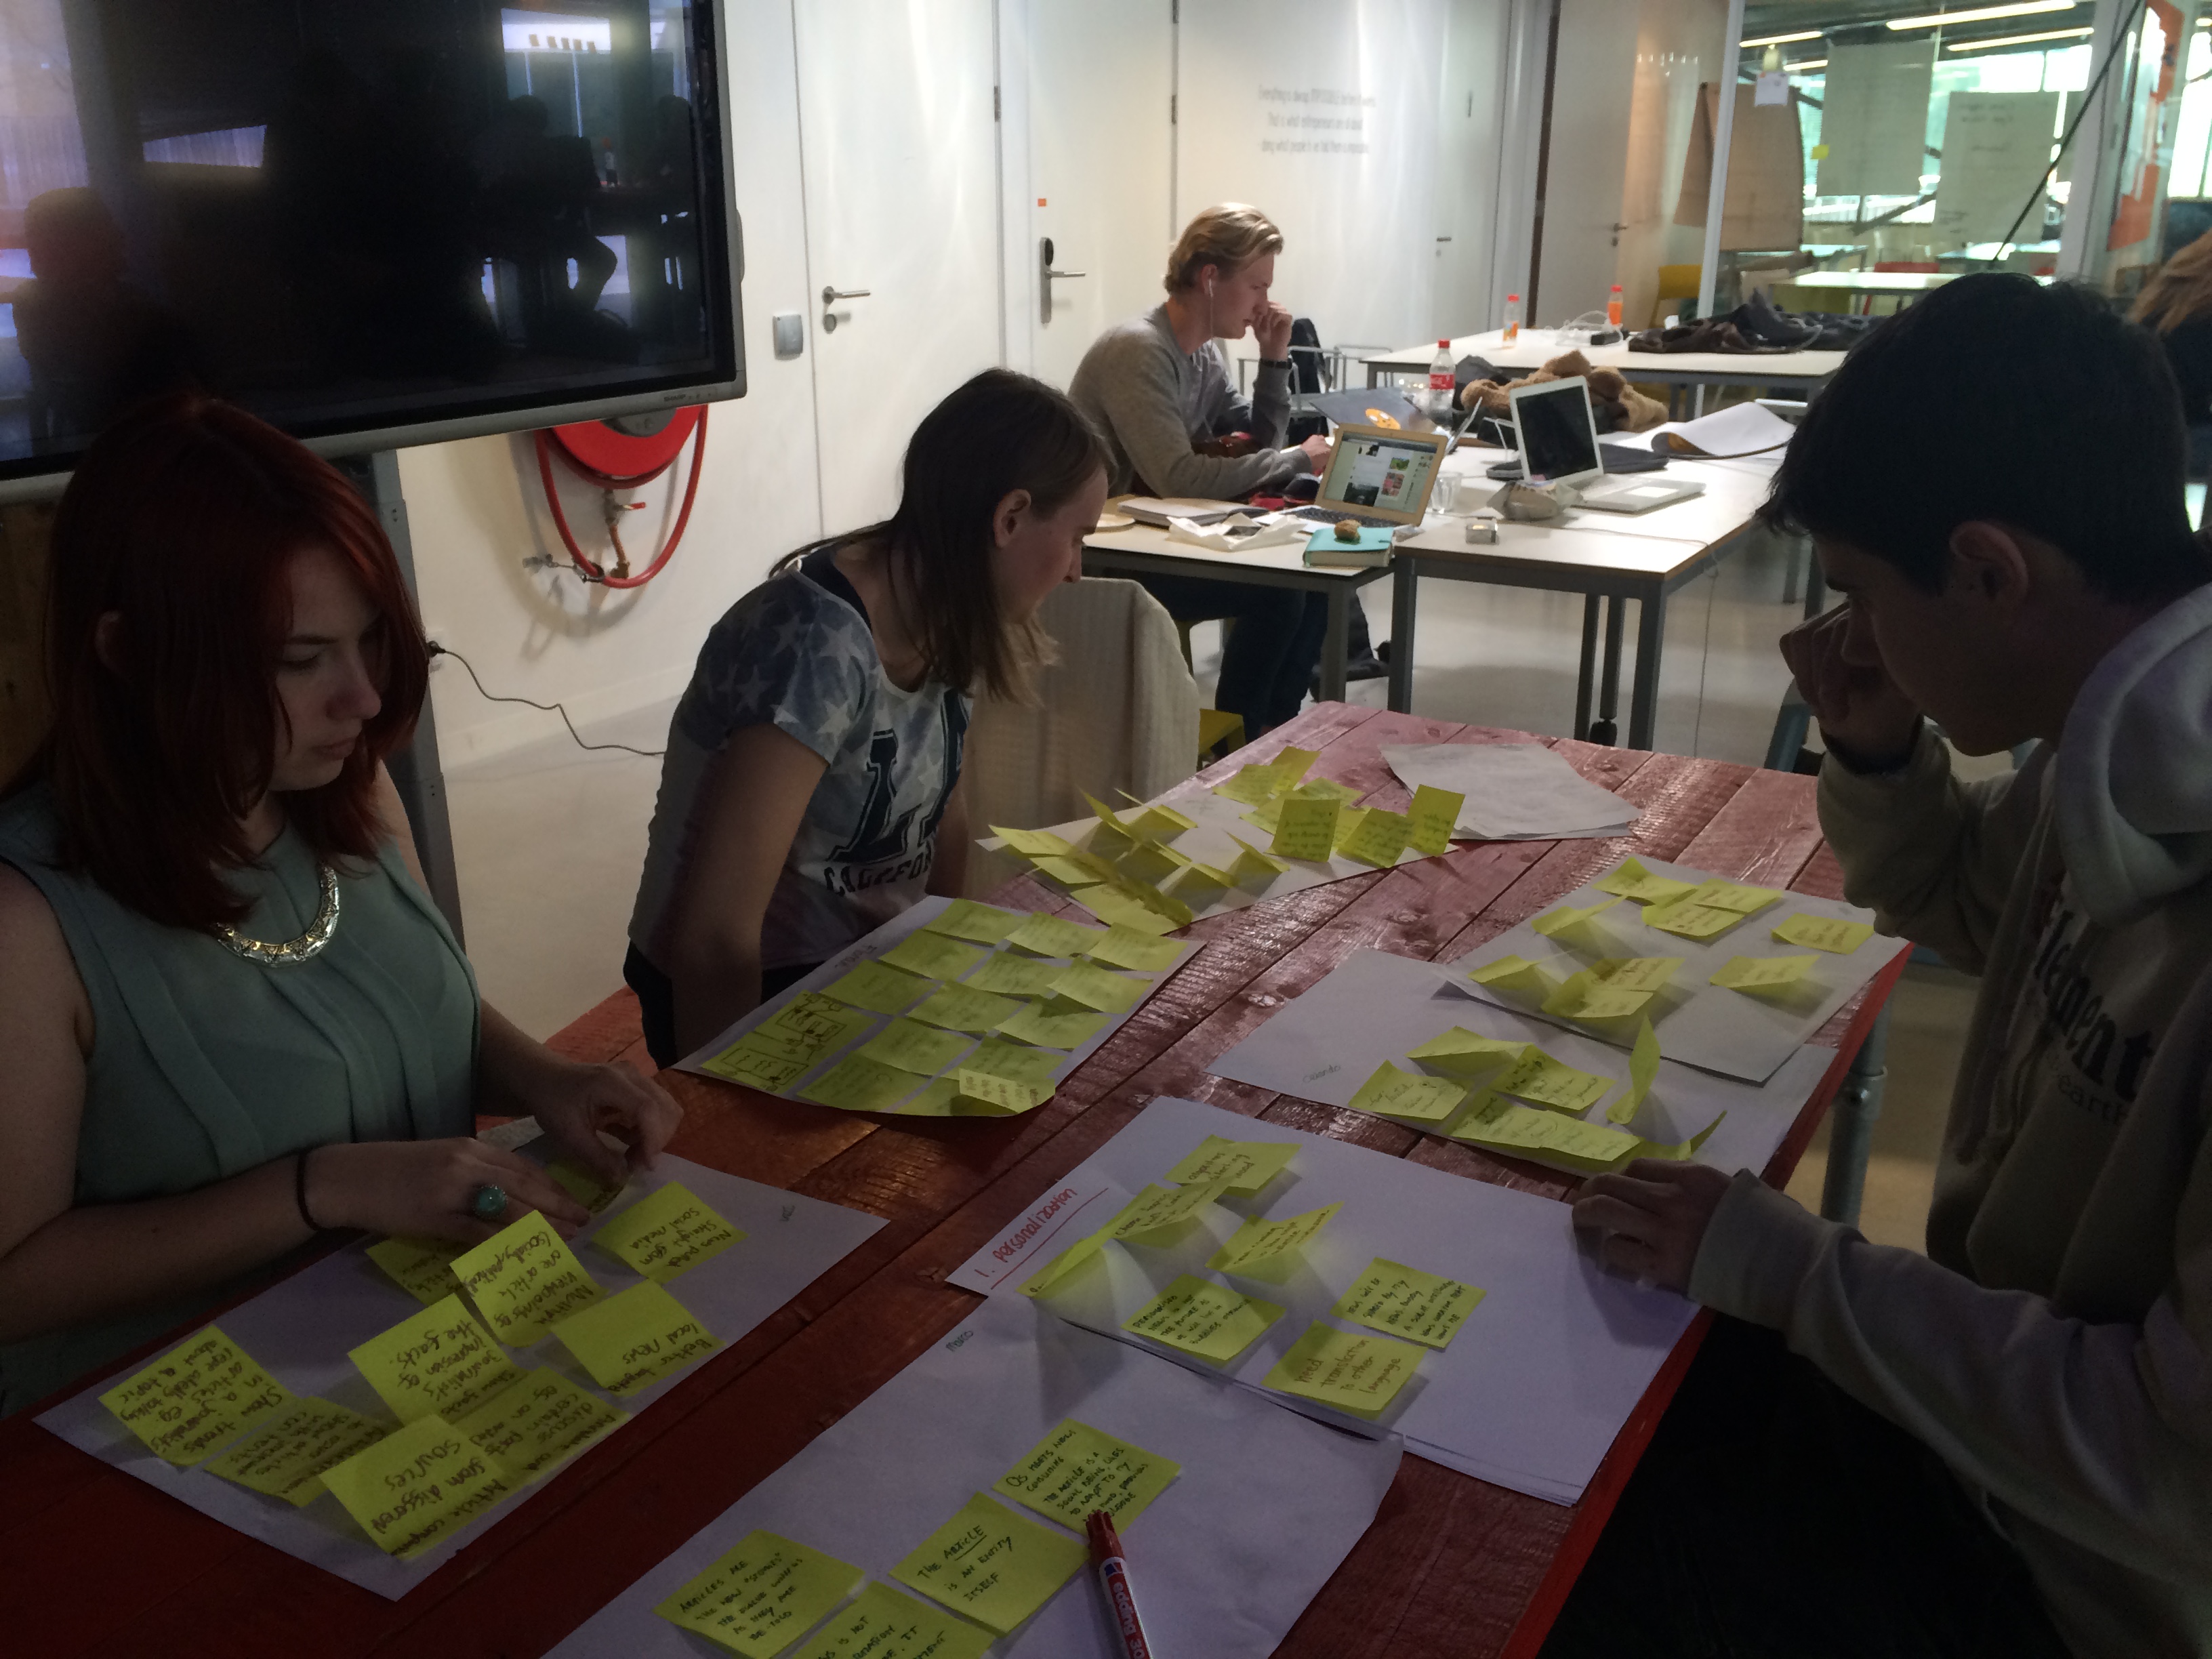
Working…
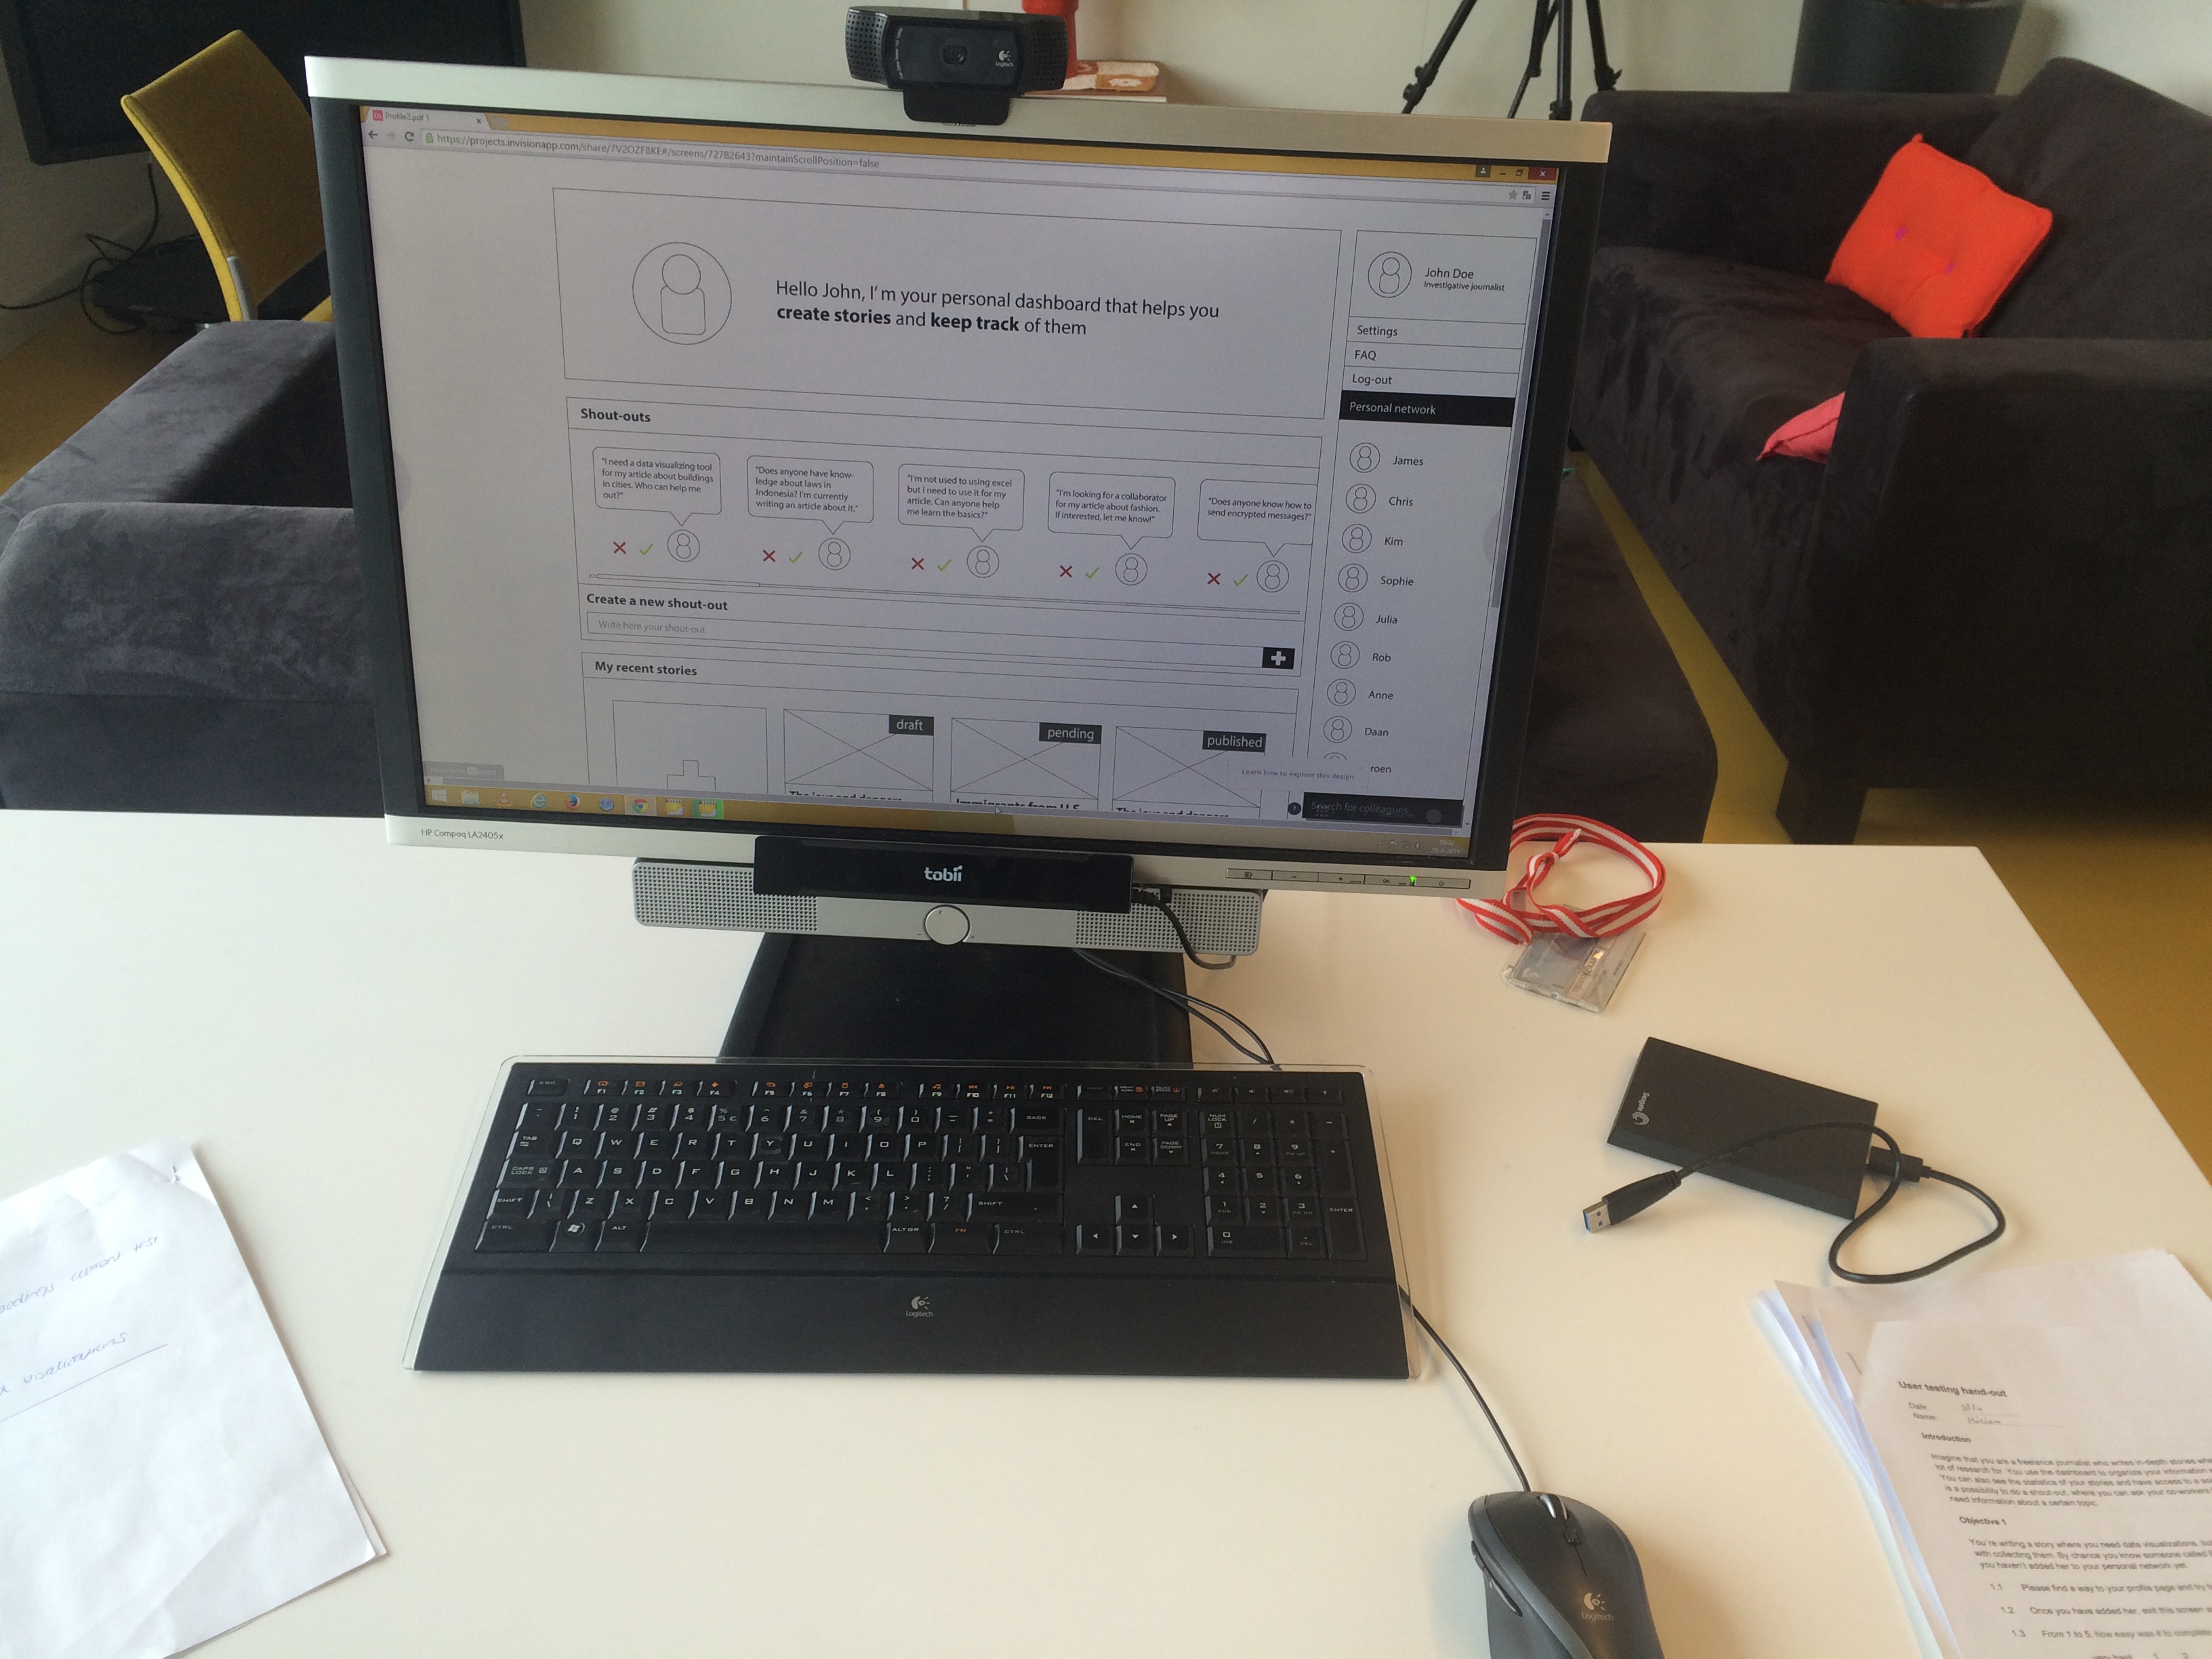
On Wednesday, we had a workshop User Testing from Jochen. This was particularly useful, because we planned to do user tests at the Usability LAB in the week after. He really helped us using the eye tracking system.
April 28 – May 1st
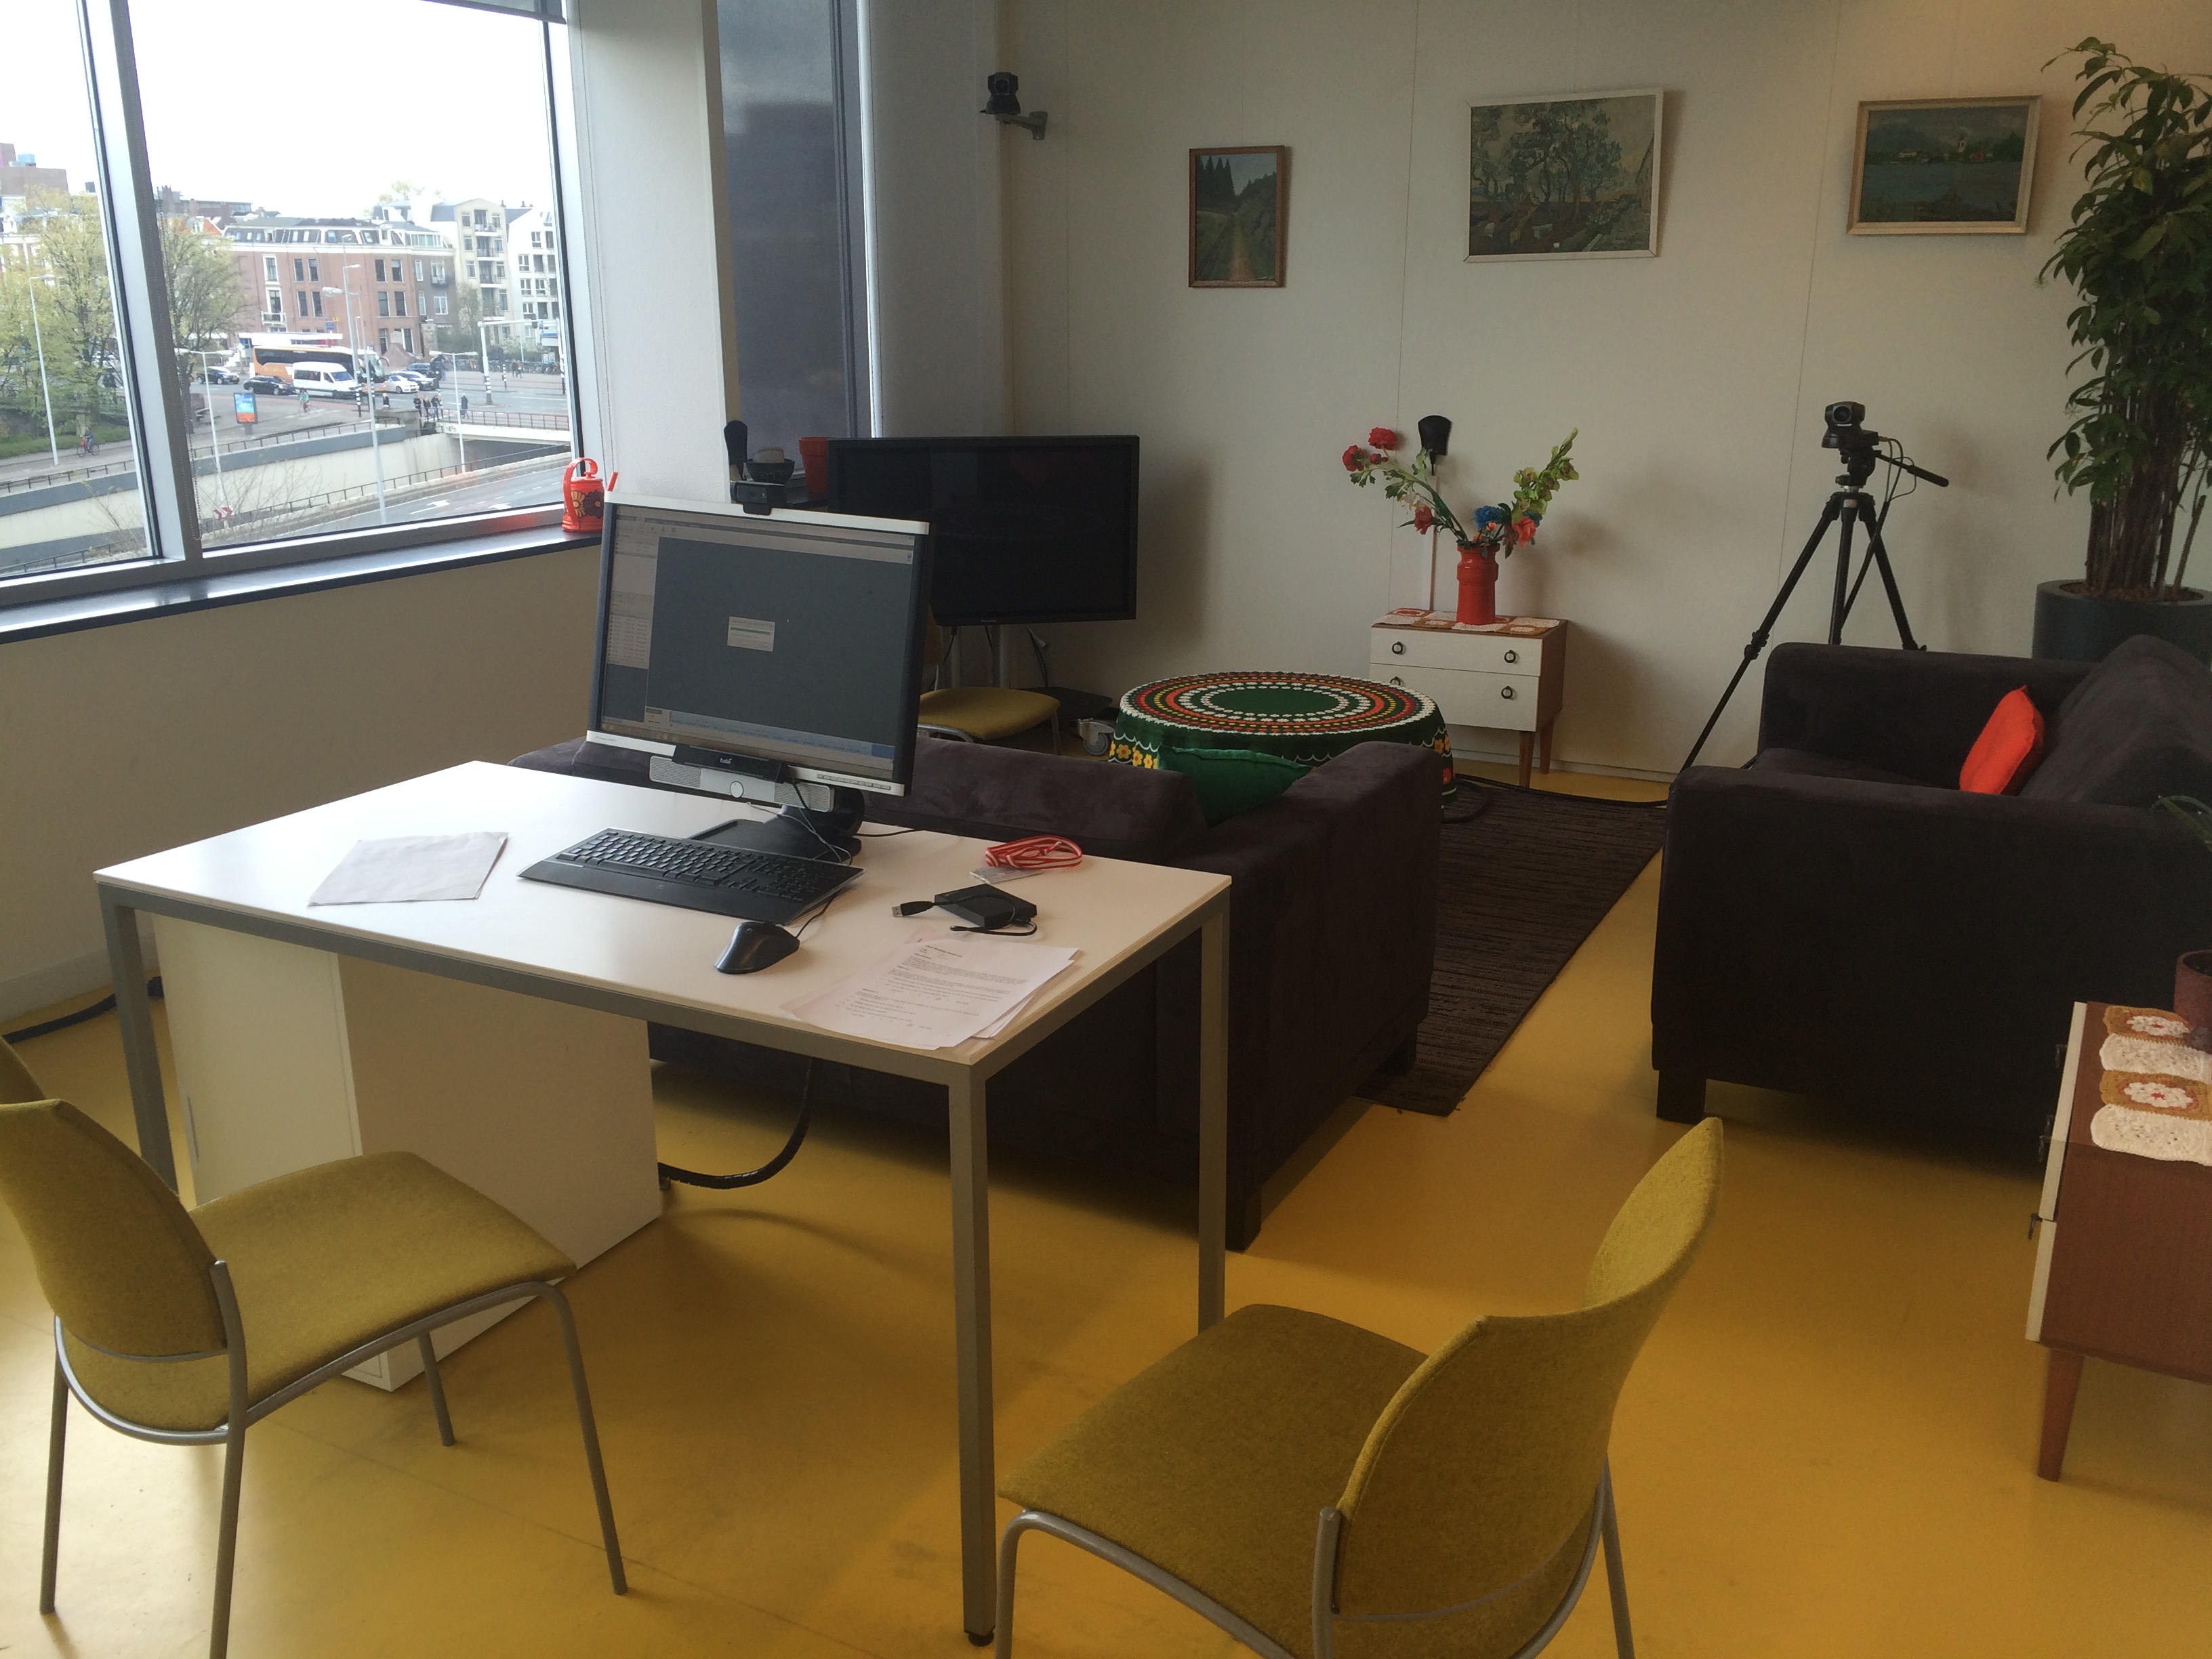
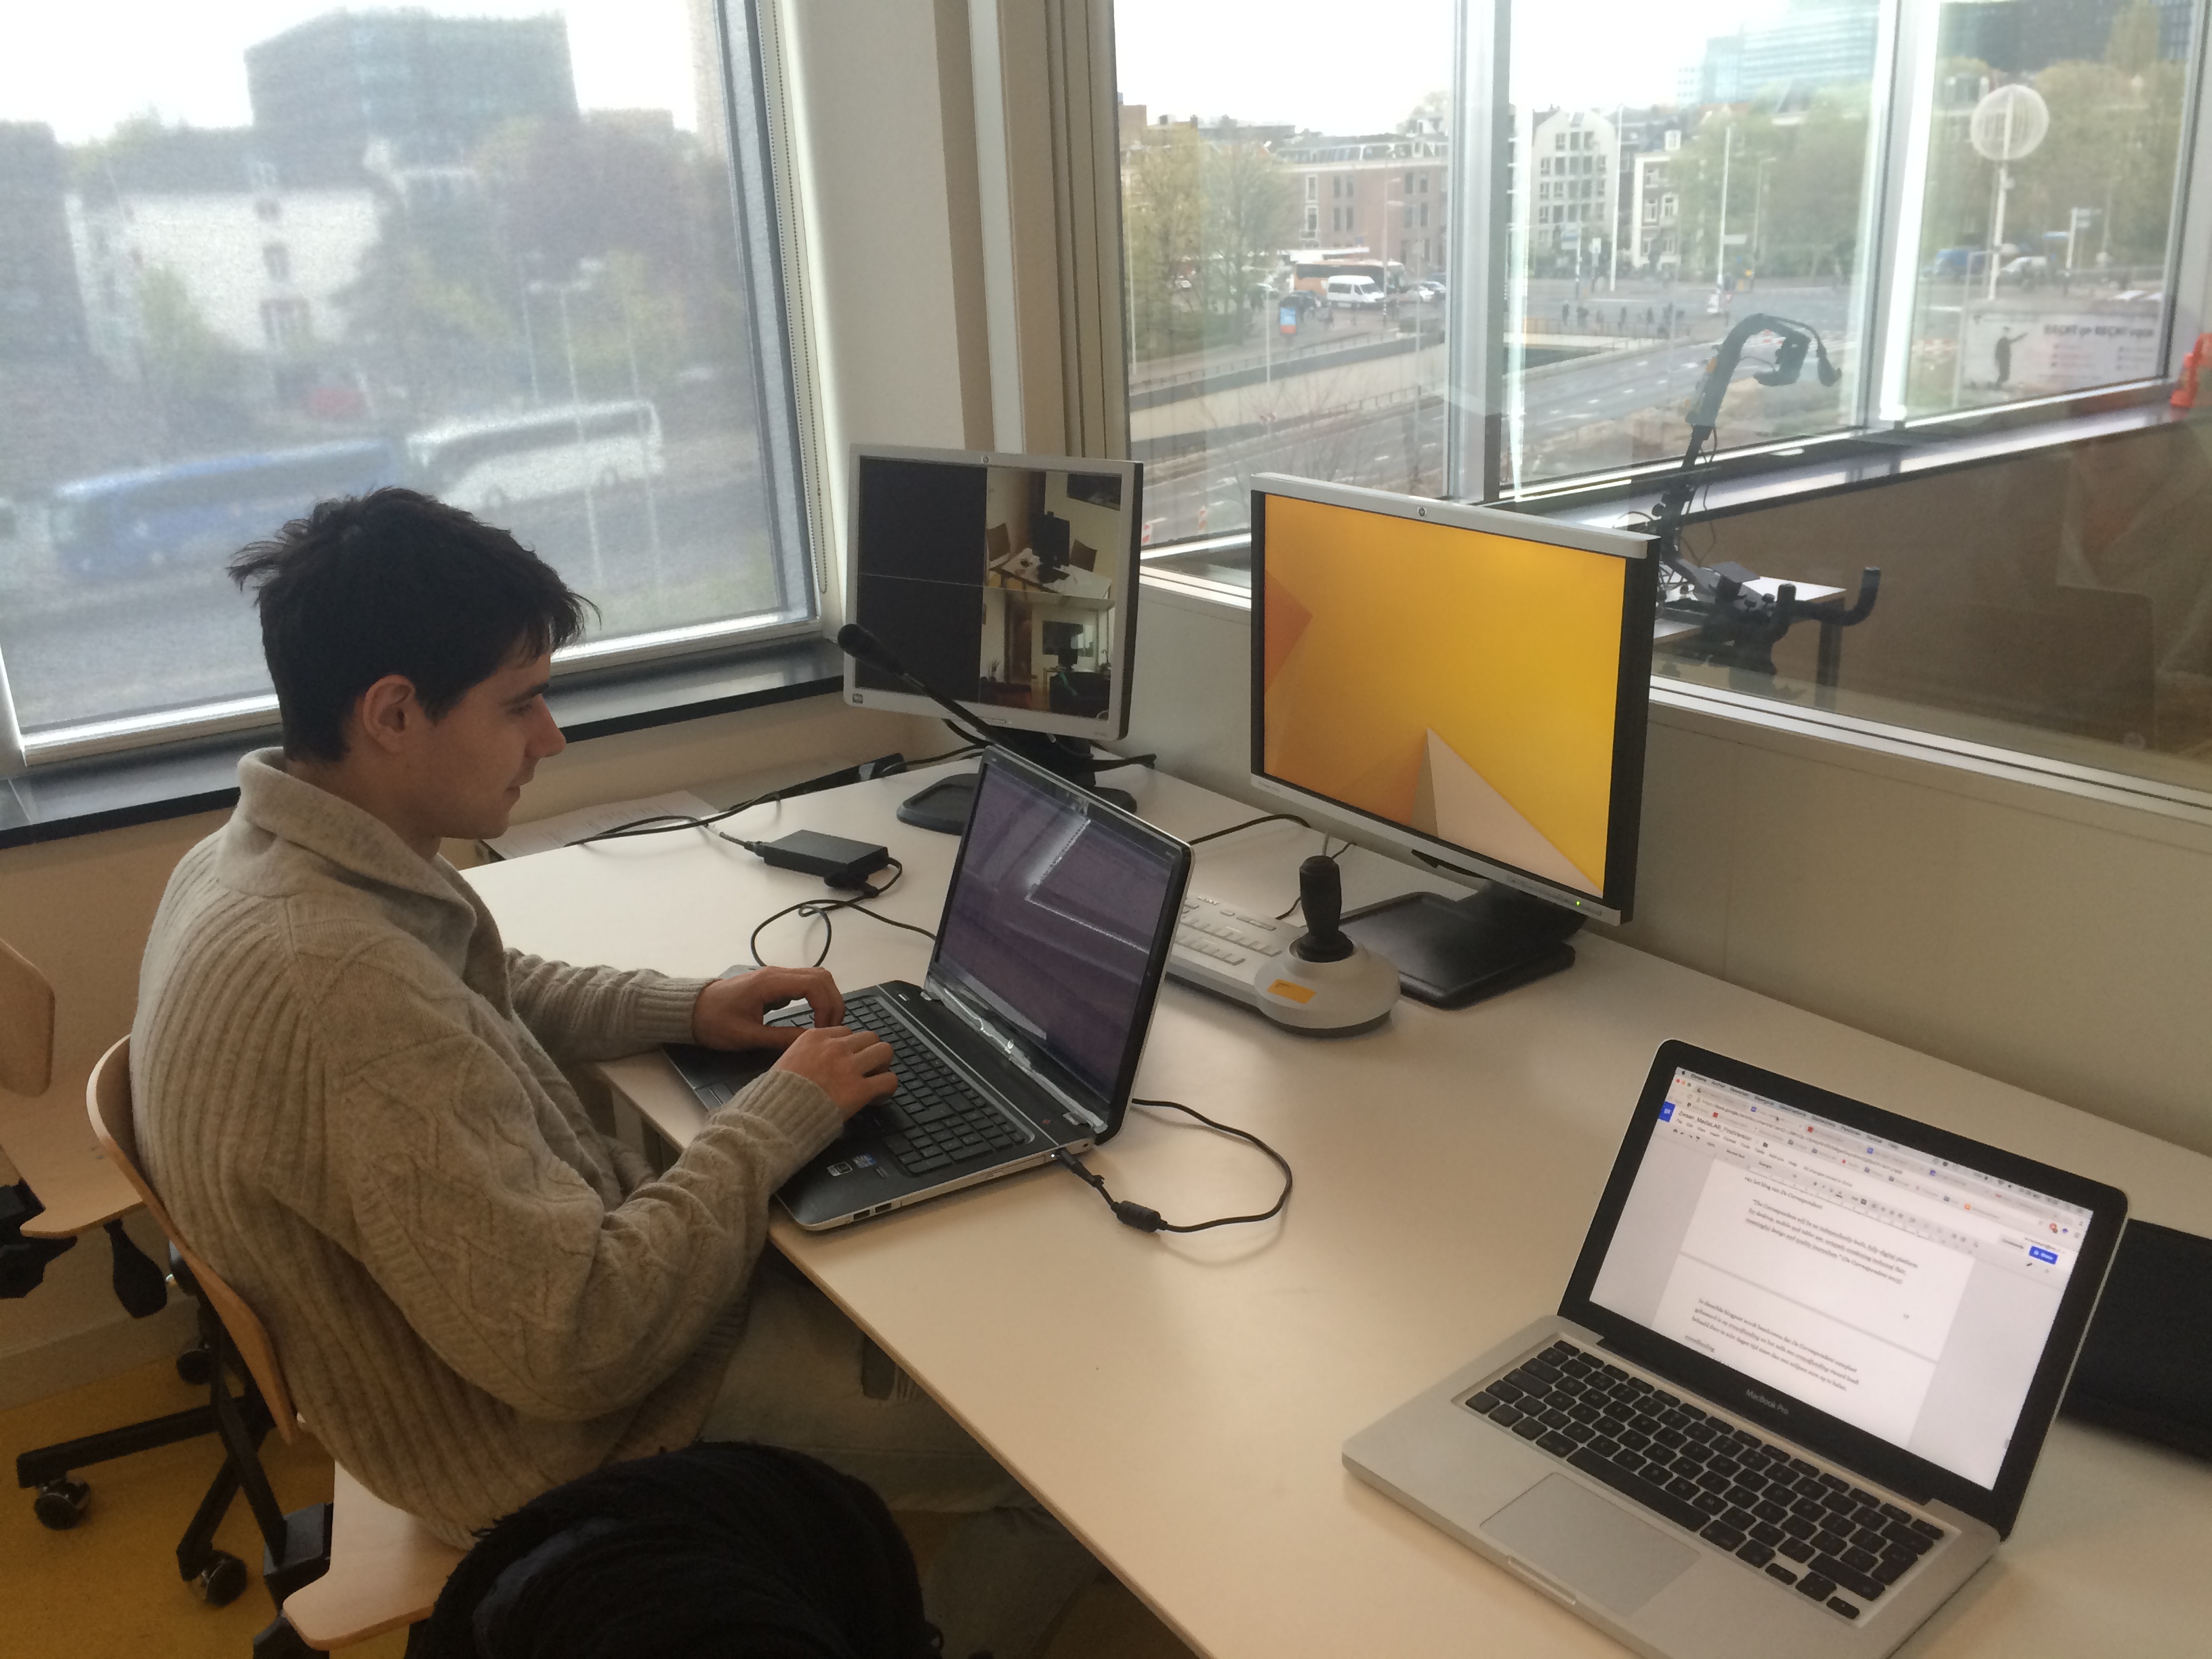
On these days, we conducted user tests at the Usability Lab, making use of the eye-tracking system. Here are some photos from the results:
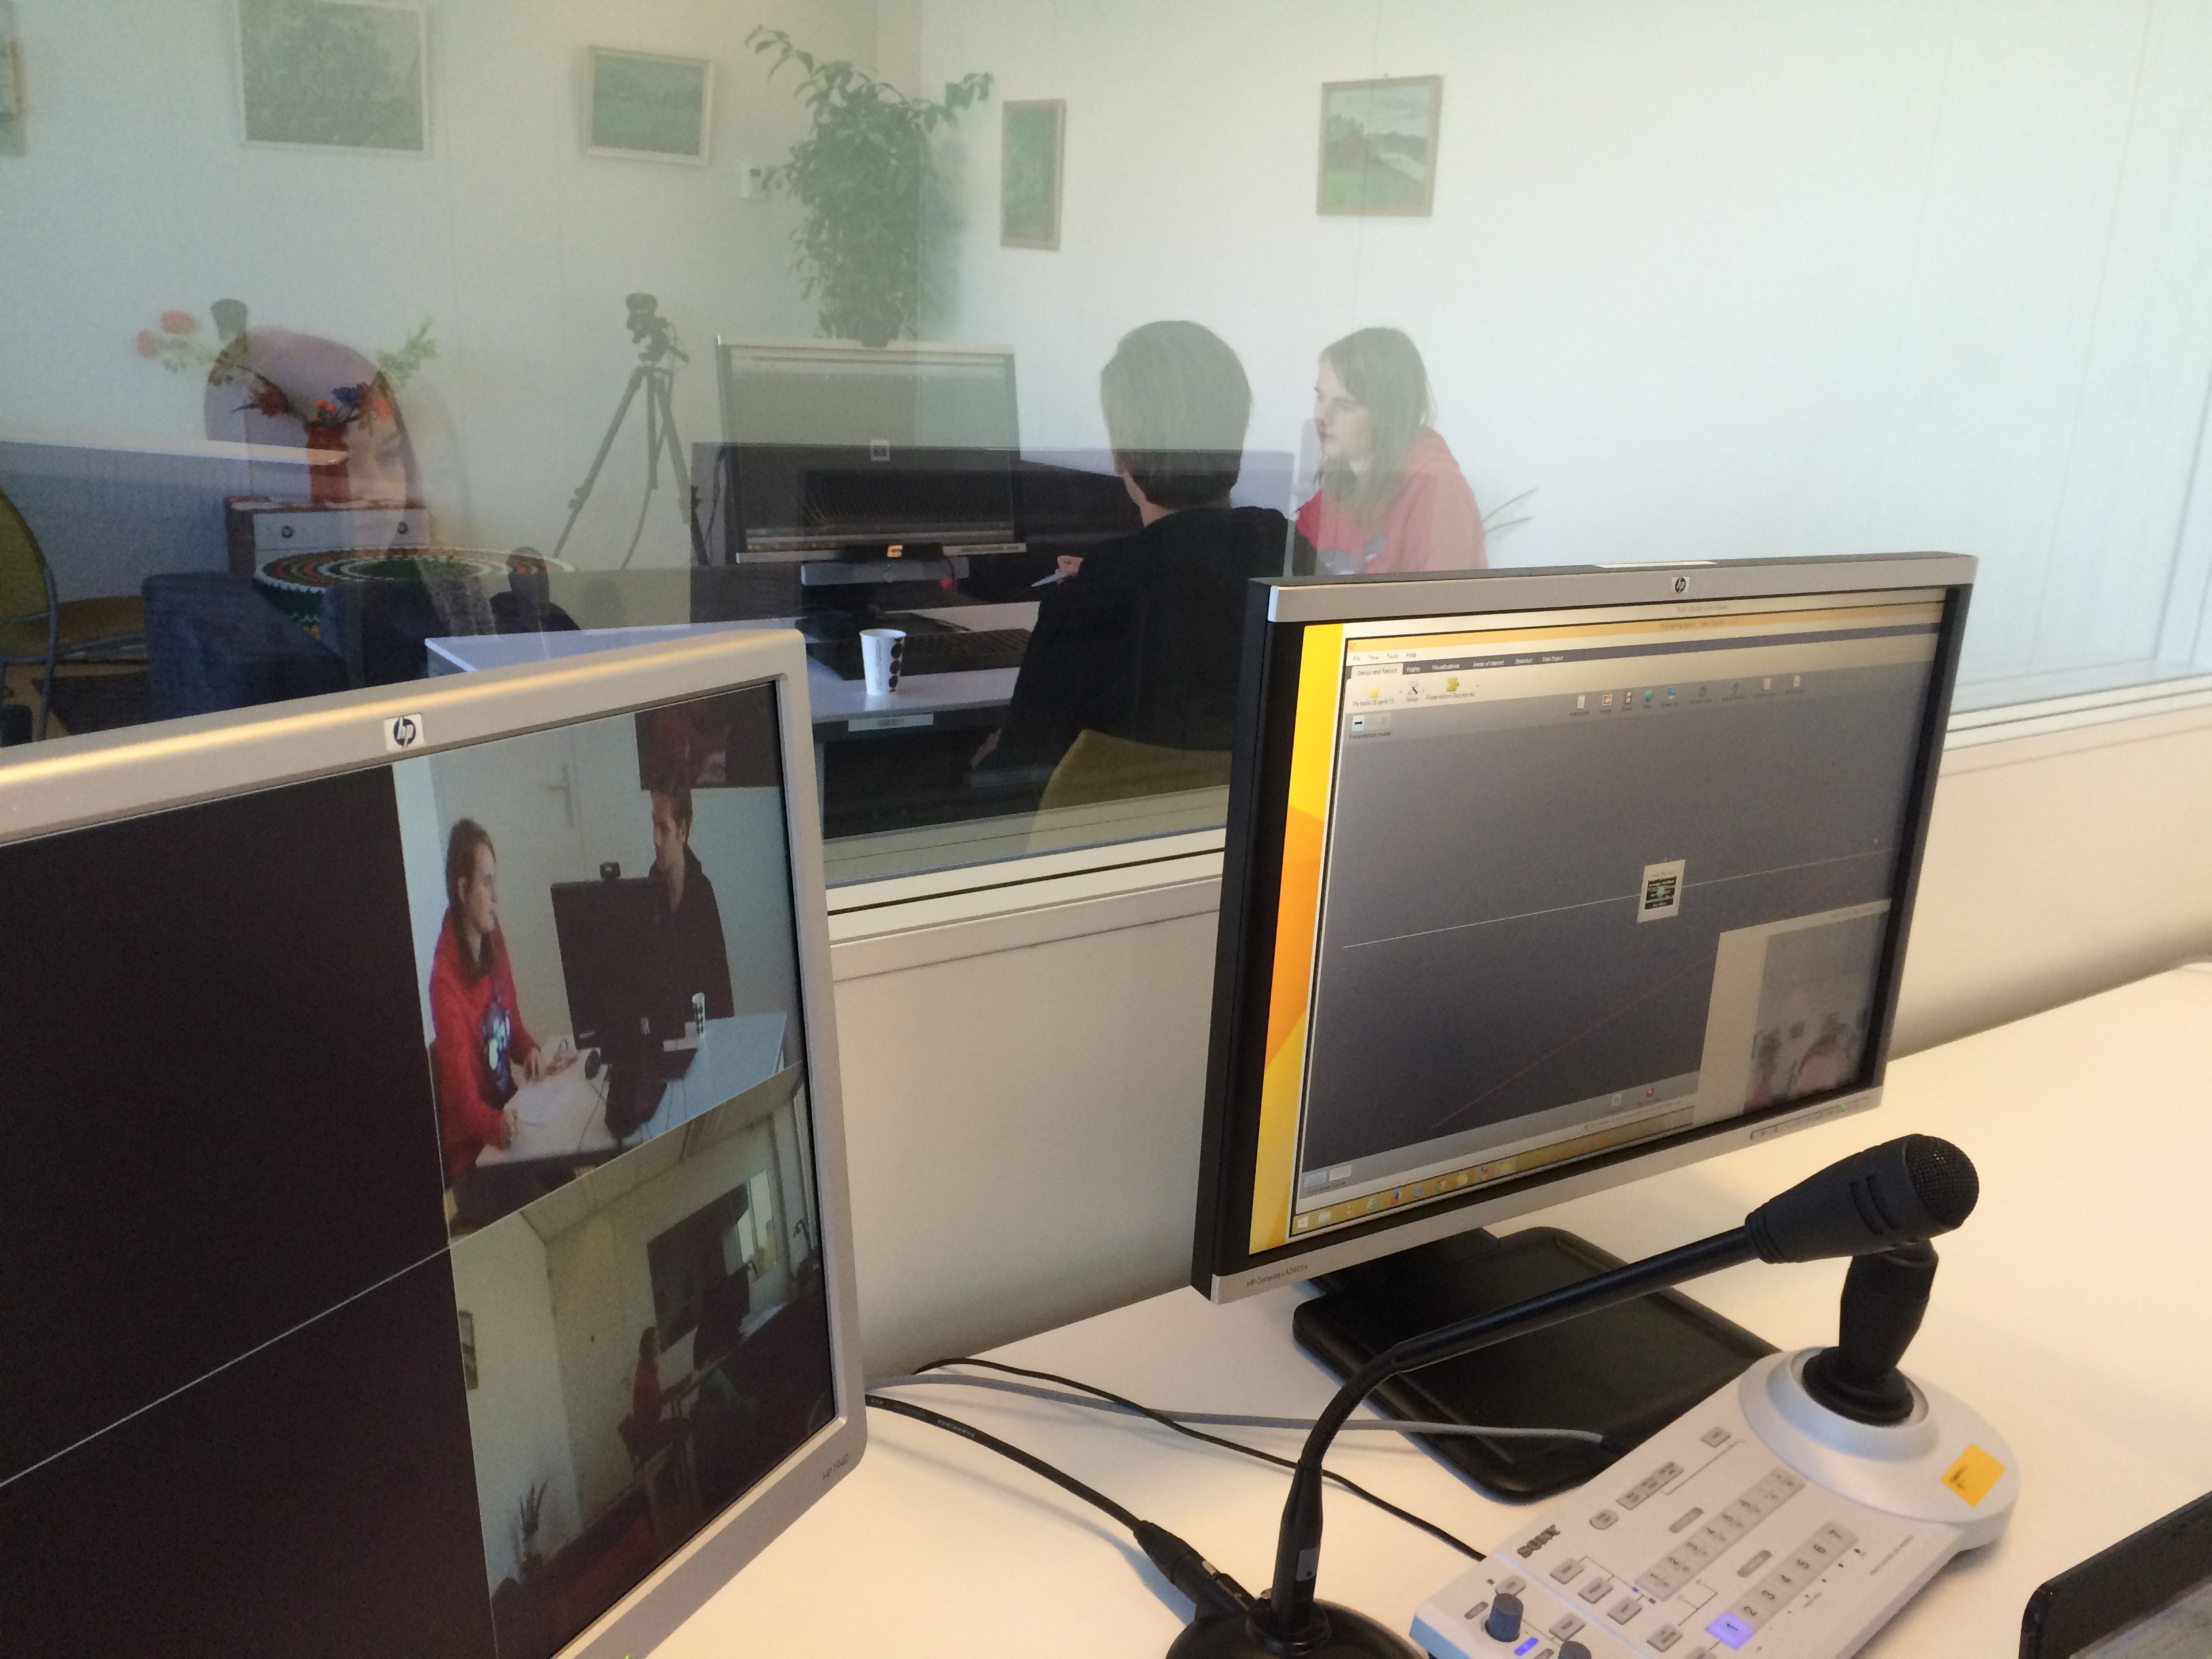
User testing at Usability Lab
User testing at Usability Lab
User testing at Usability Lab
User testing at Usability Lab
On the first photo, you can see that there is a glass wall in the Usability Lab, where the participants can’t look through. However, we could still see them. It was a really nice experience to work with a professional system like this and it gave us some great insights. For example, we came up with the idea of a pinboard as a way to organize information coming from different sources like file types, websites or platforms. Here, you could easily ‘pin’ the different sources and categorize them according to the article it relates. On this photo, you can see a heat-map that shows where a certain participant looks at while doing a user test.
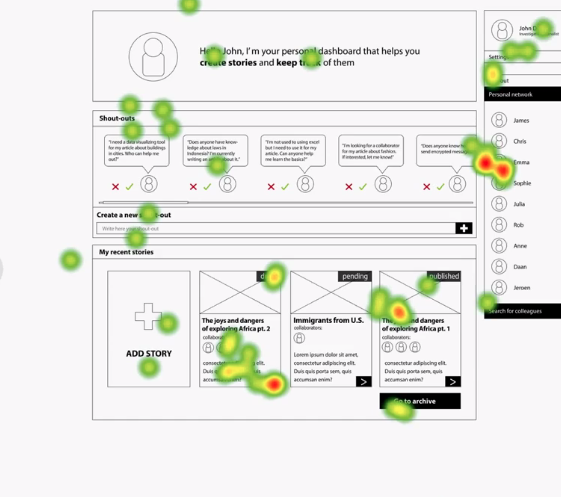
Heat-map User Test
With these results, we could see wether people looked at the right elements and check to what extent our tool is user-friendly.
Prototypes/modules
We also did a lot of research in this sprint about the different innovative techniques we could implement in our dashboard, to make sure it would become more innovative. Here’s a summary of it:
-
Sentiment Analysis
-
Automatically Tagging
-
Article Impact Prediction
-
Encrypted Messaging
-
Recommendation Systems
-
Content Extractor
-
Annotations / co-creating
-
Geo-tagging
We chose to make a prototype out of the first three:
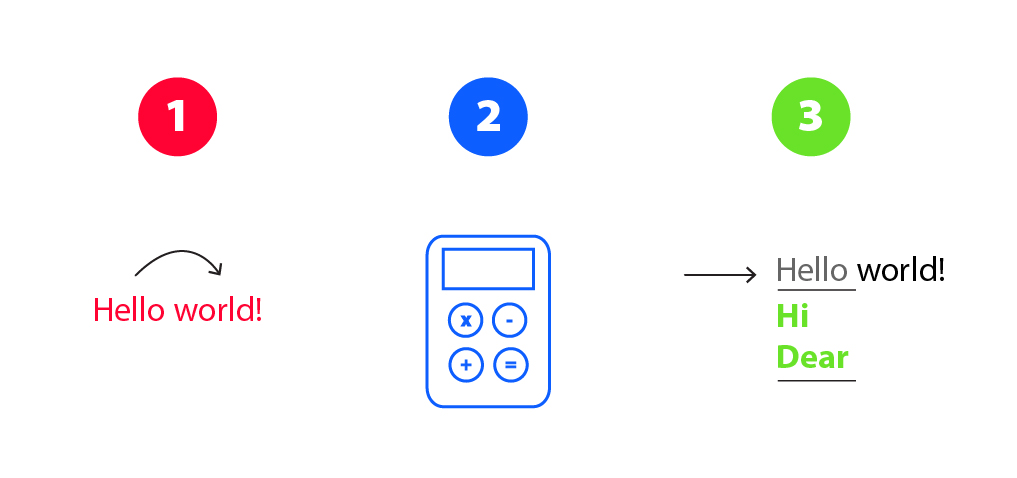
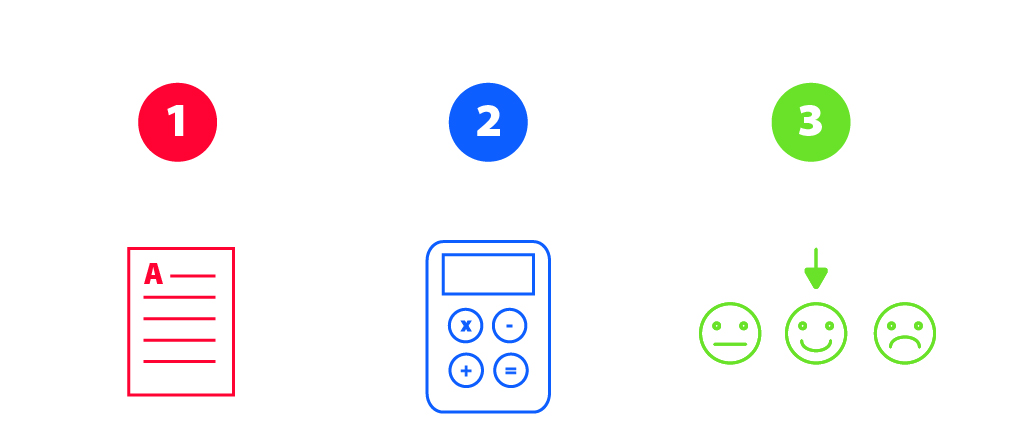
User Story #4: Sentiment Analysis
User Story #4: Title Improvement
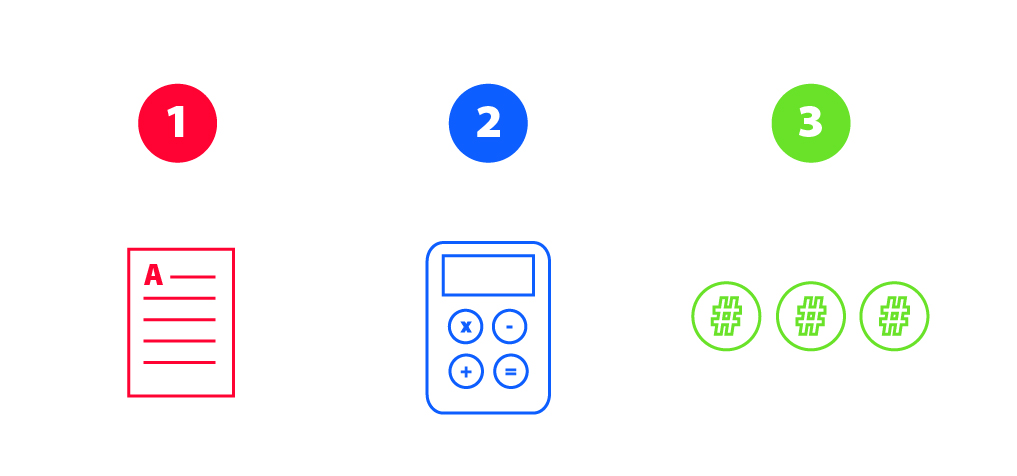
User Story #4: Automatically Tagging
Goals for Sprint #5
Right now, we are at the end of sprint #4. For Sprint #5, we hope to program our tools and insert the small prototypes we made during this sprint. Furthermore, we want to program our prototype and make it visually attractive. In the end, we also want to test our prototype, with the final design, and if there’s enough time, we want to adapt the feedback of the user tests to our prototype.