


Sprint 2 – Exploring the Network
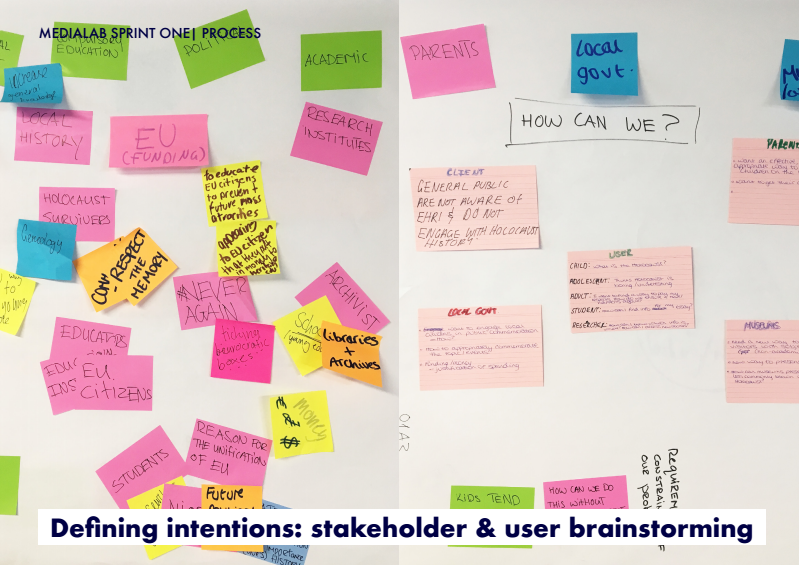
Having looked into potential target demographics during sprint one, this time we decided to explore the partners that make up the EHRI network. We wanted to know general statistics of each partner that has a public facing, as well as what makes them stand out from the rest. Overall, our goals this sprint were the following:
- Gather insights from a map displaying how individual partners engage with their public and with each other.
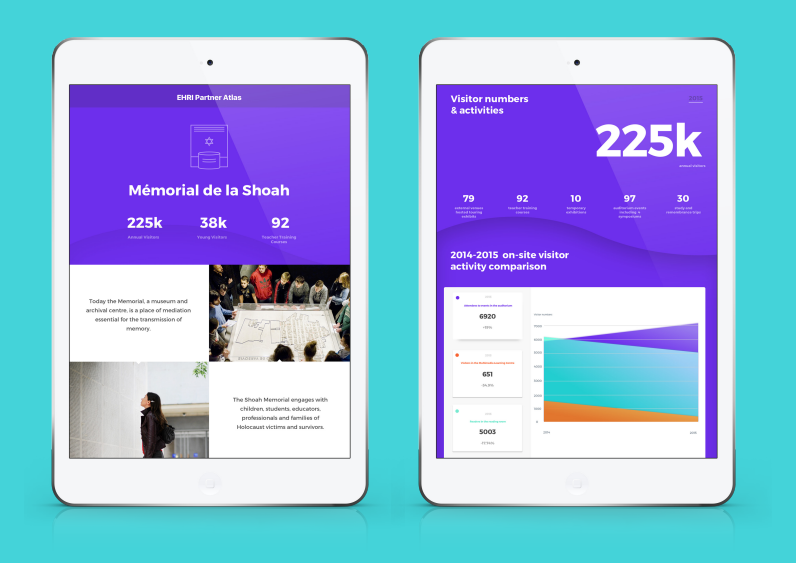
- Gather information from all participating organisations (visitor numbers, number of Facebook followers etc.)
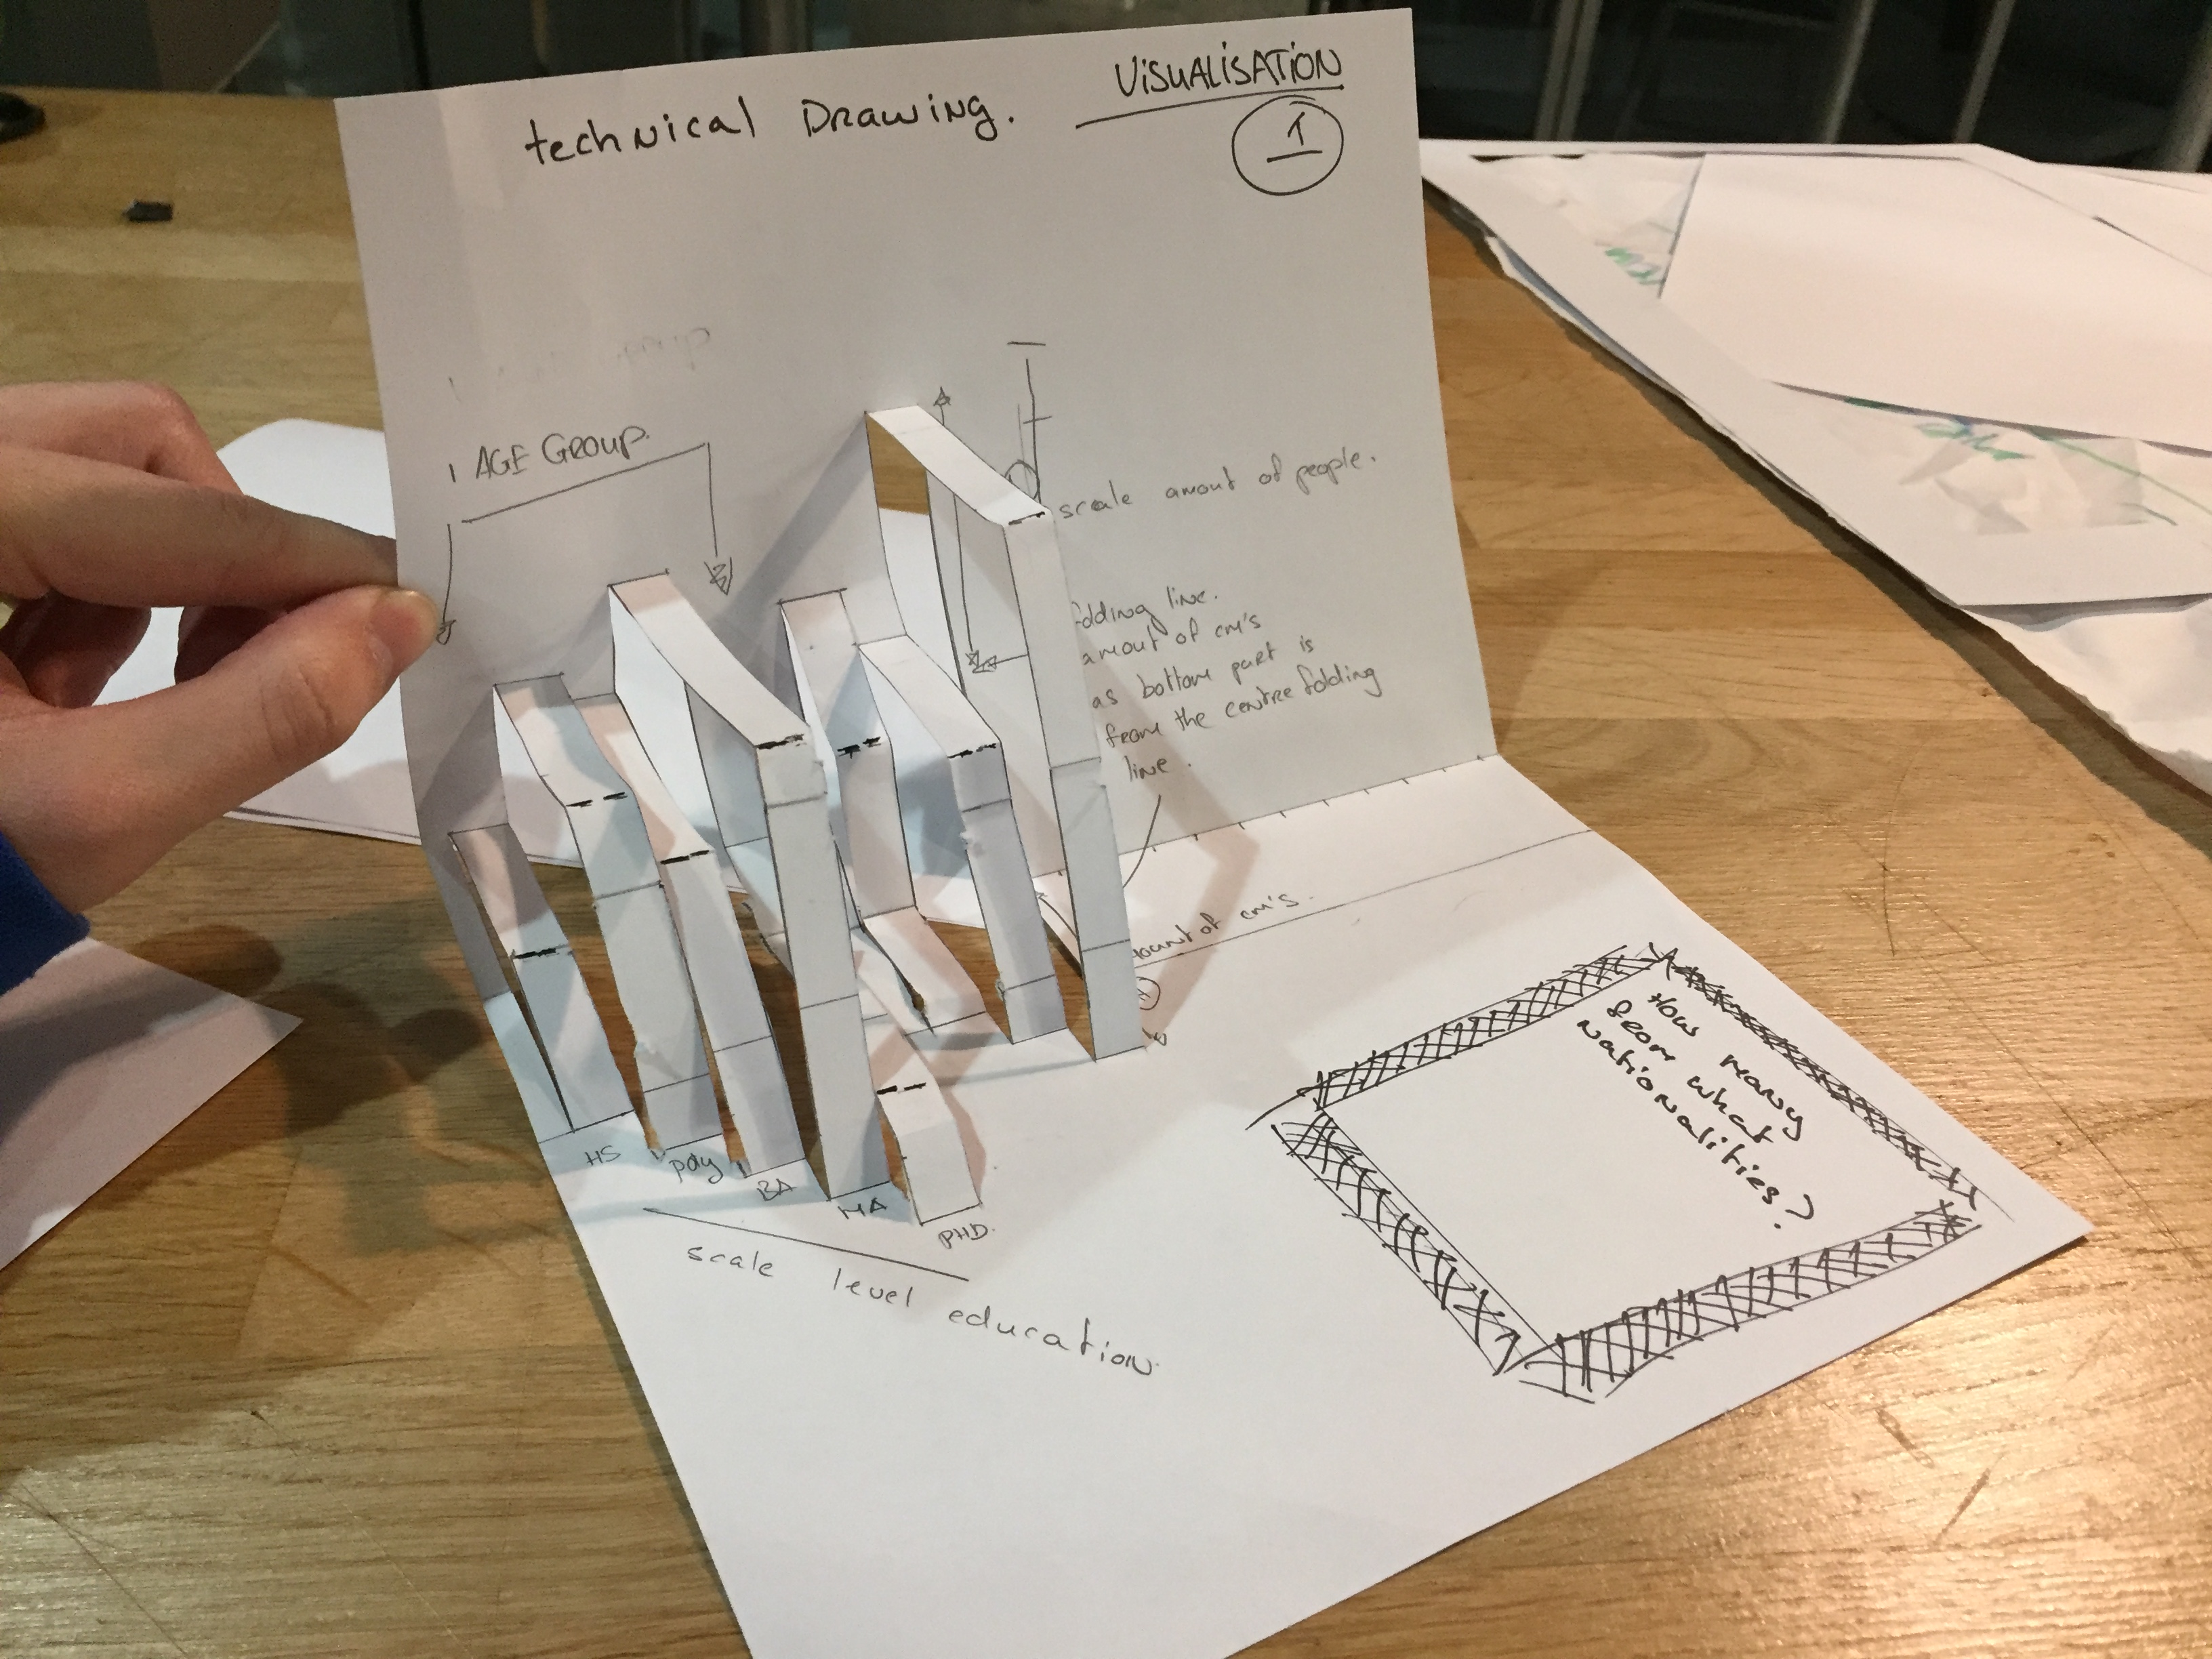
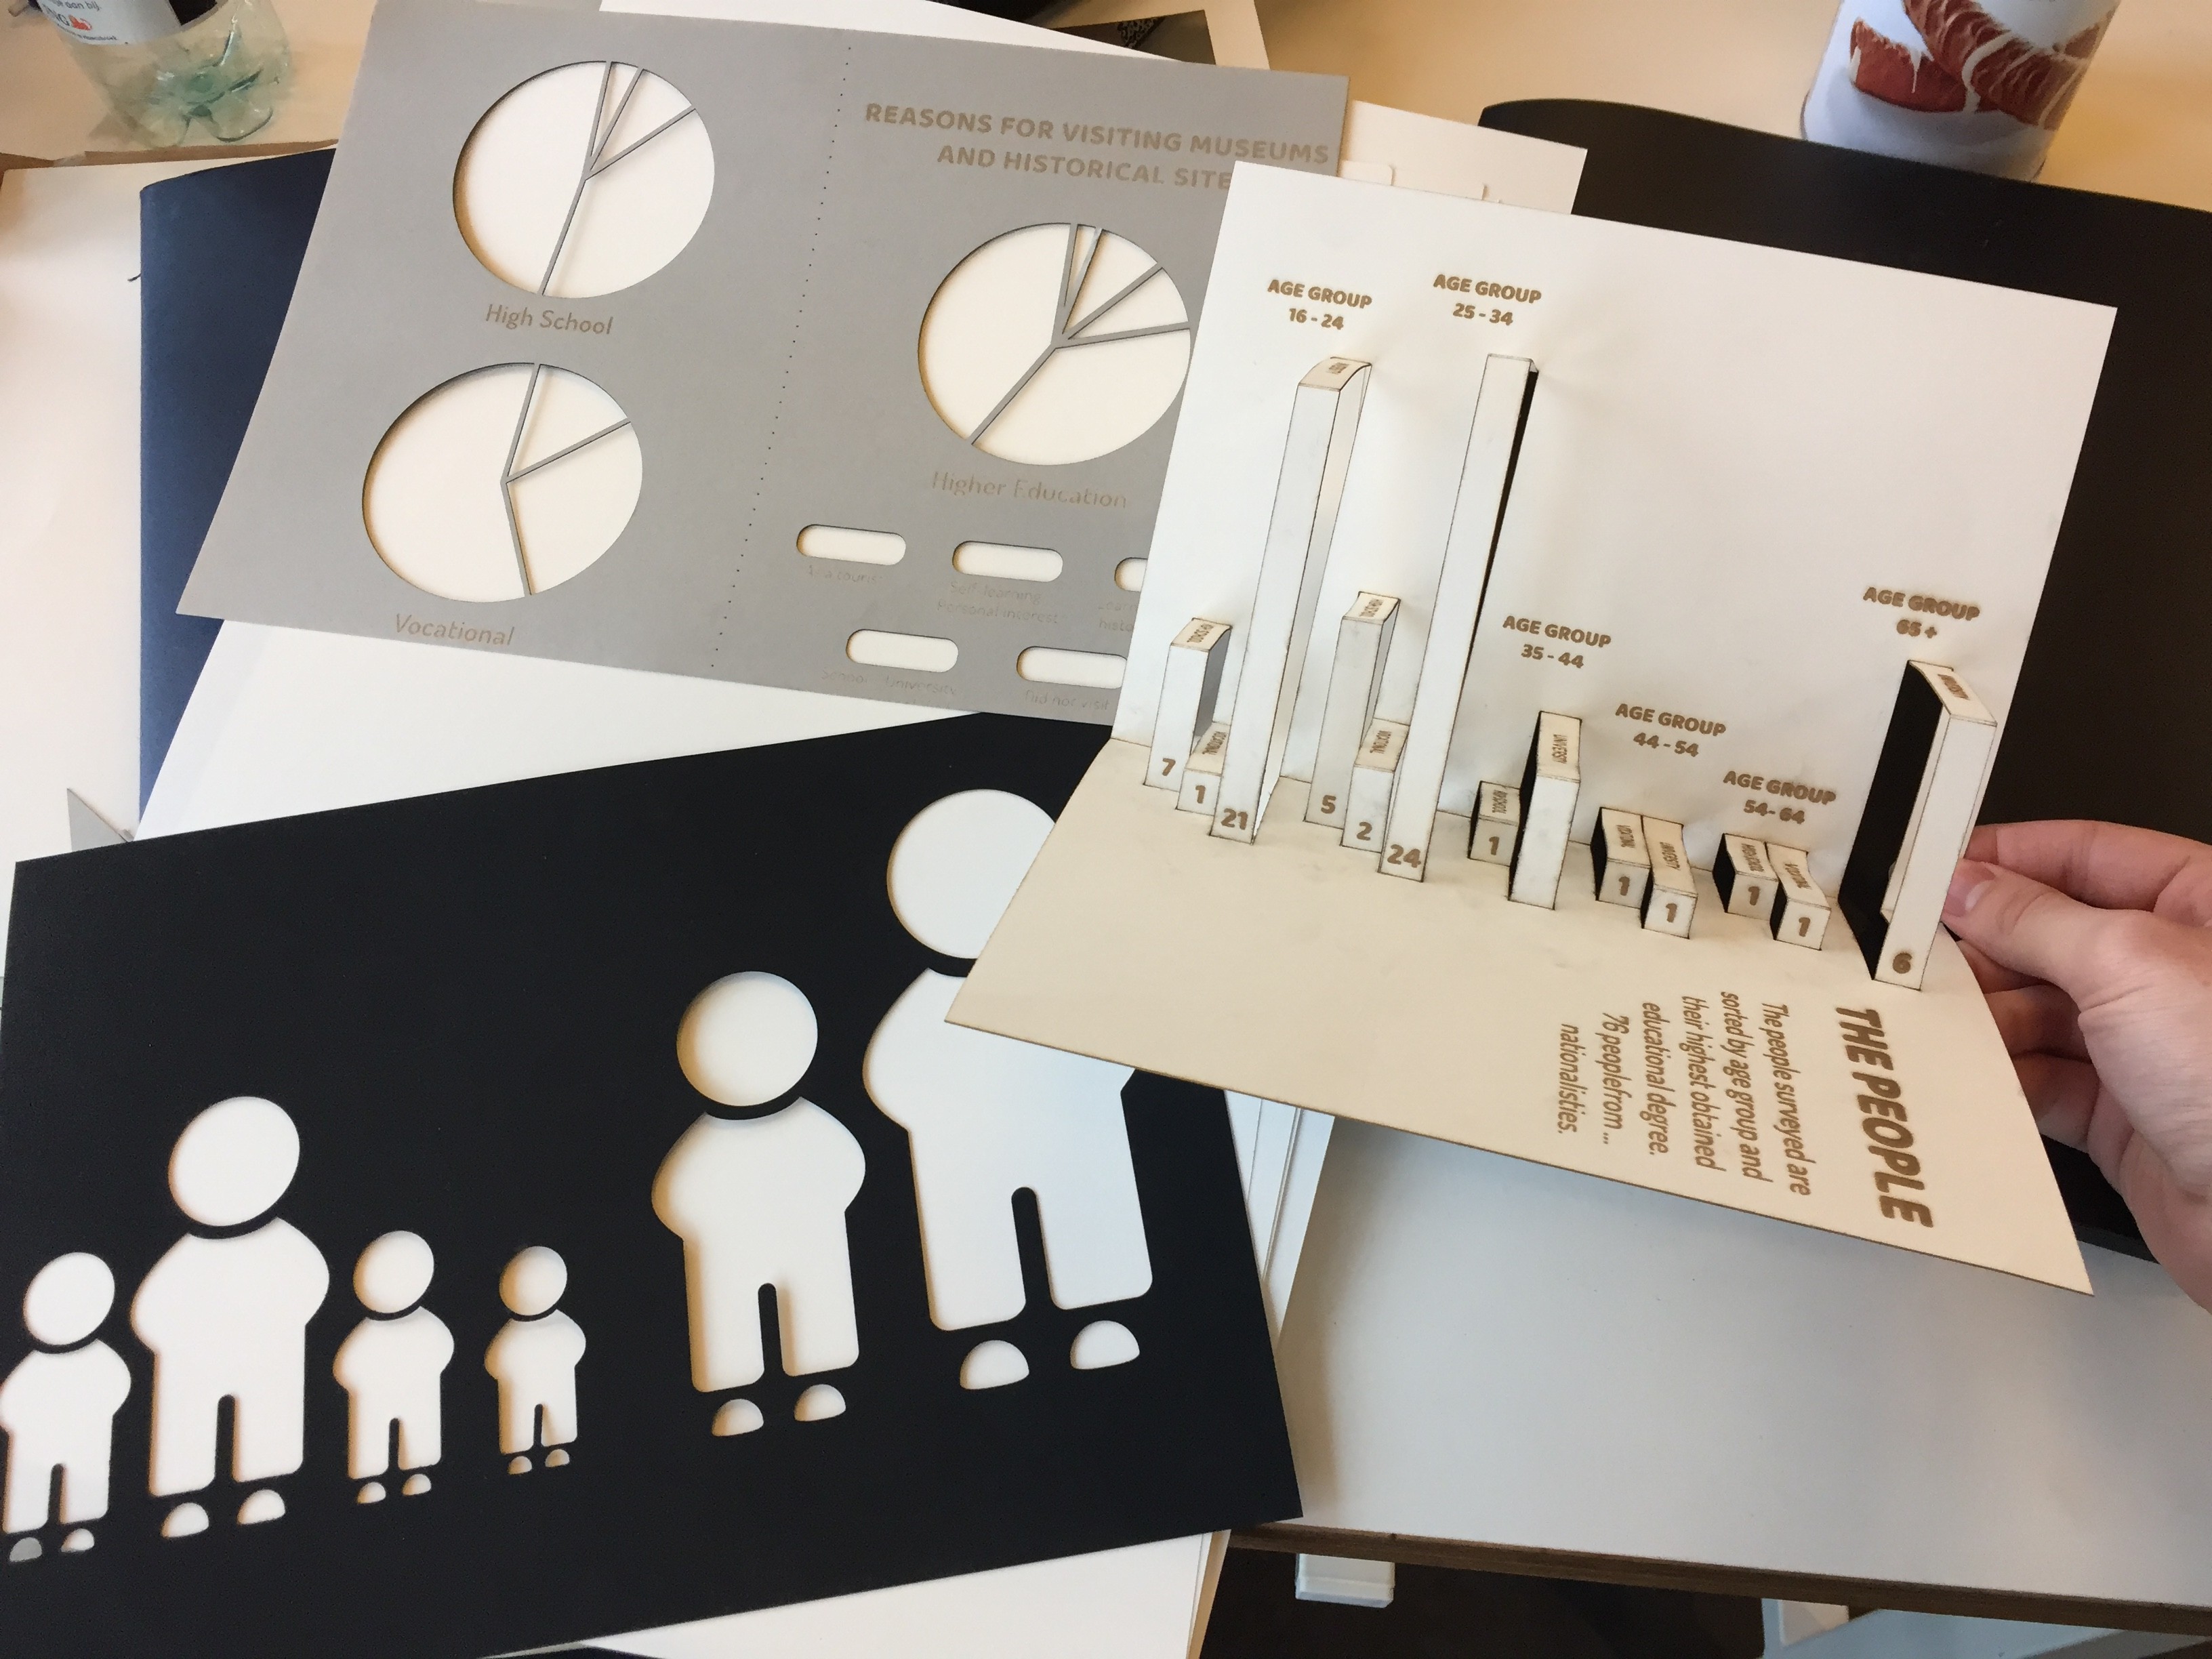
- Create a physical visualisation of this aggregated data.
Back to the SCRUM board
The Research
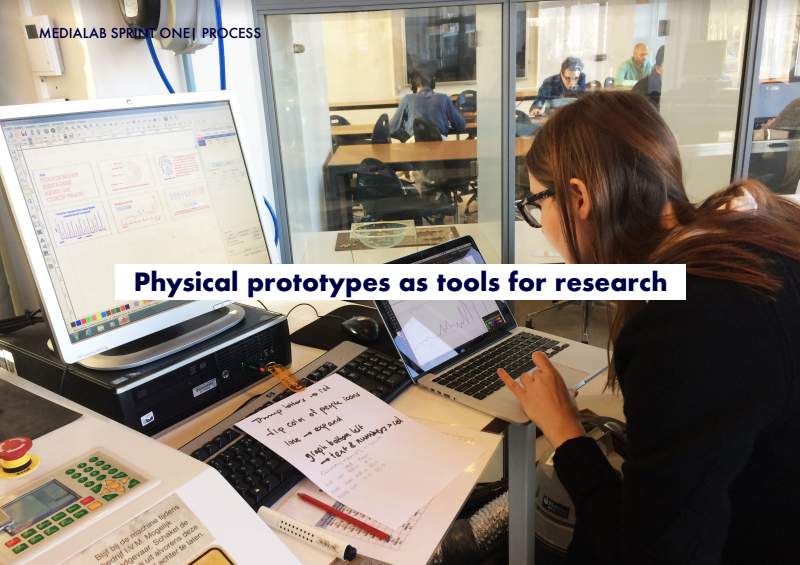
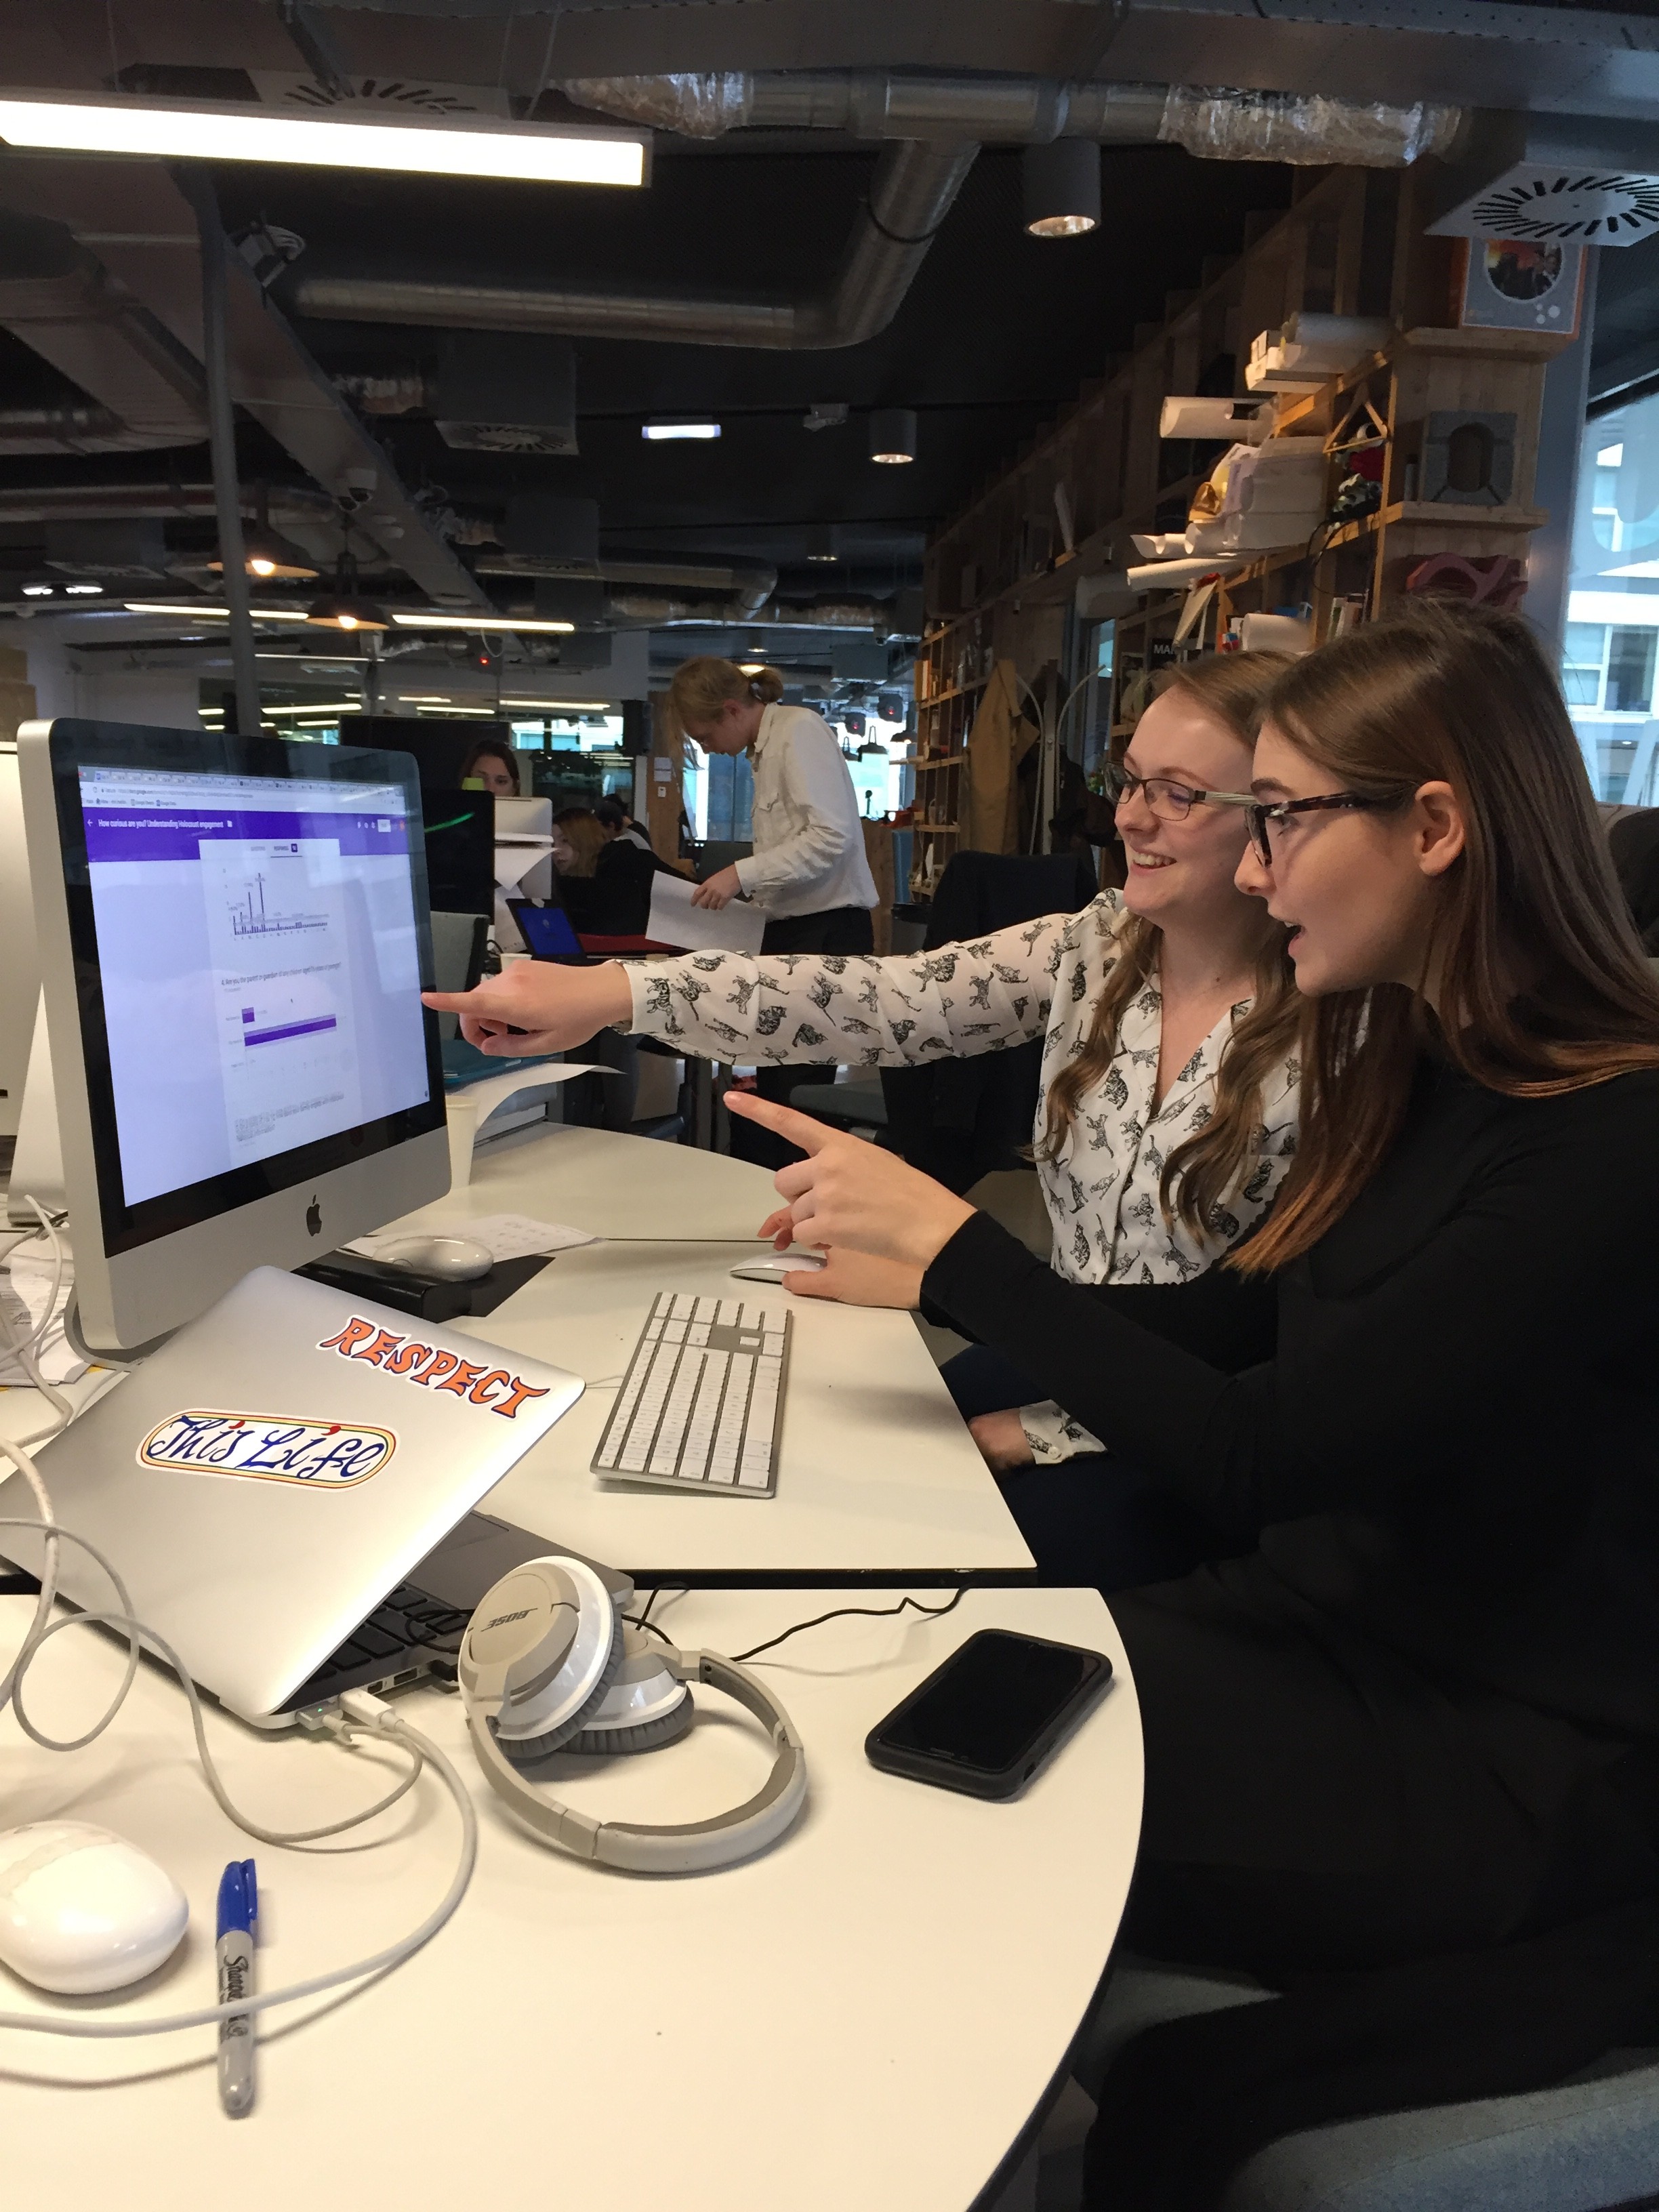
Given the fact that EHRI has multiple partners spanning all over Europe and beyond, it was important to send the emails with our questions as soon as possible, as we expected the responses to take quite a while. That was indeed the case, so while we waited for the partners to respond, we also conducted our own research based on the partners’ websites, social media presence and news articles. When responses were taking too long, we also called the partners to try and speed up the process. We found that smaller museums and archives were faster to respond and more eager to share their information.
The Visualisation
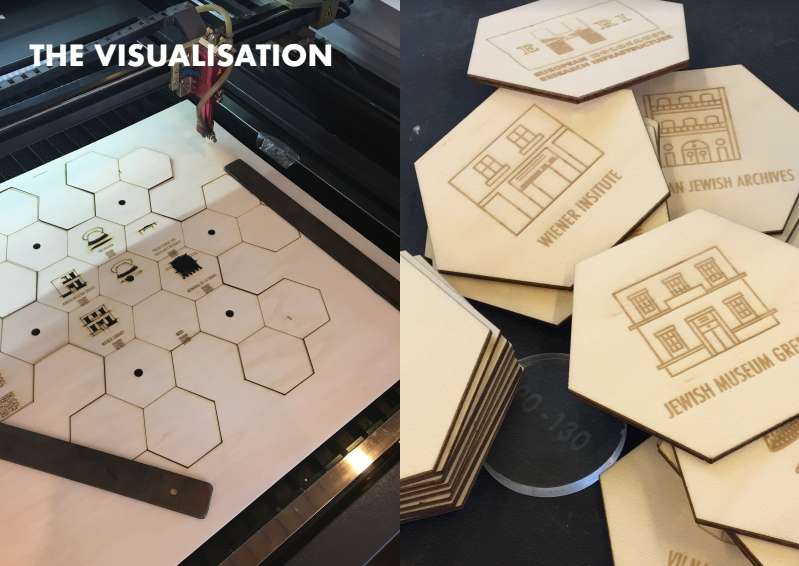
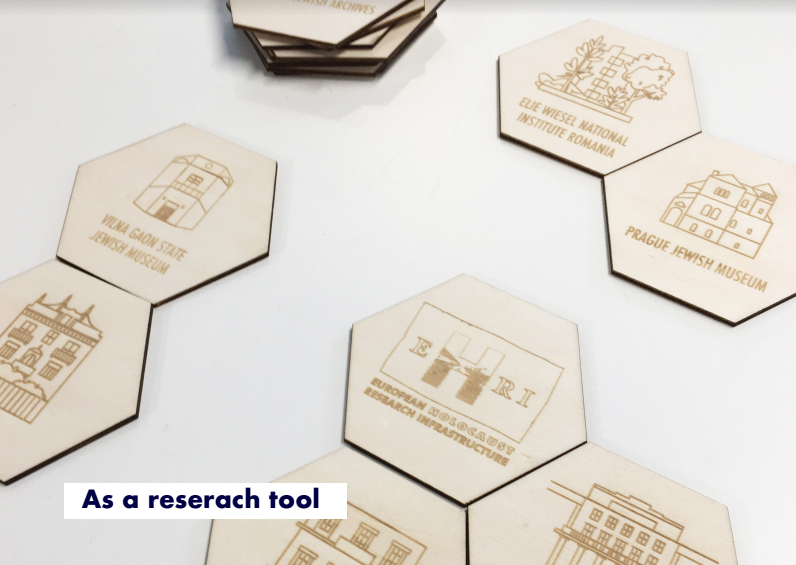
Laser cutter is our favourite tool now
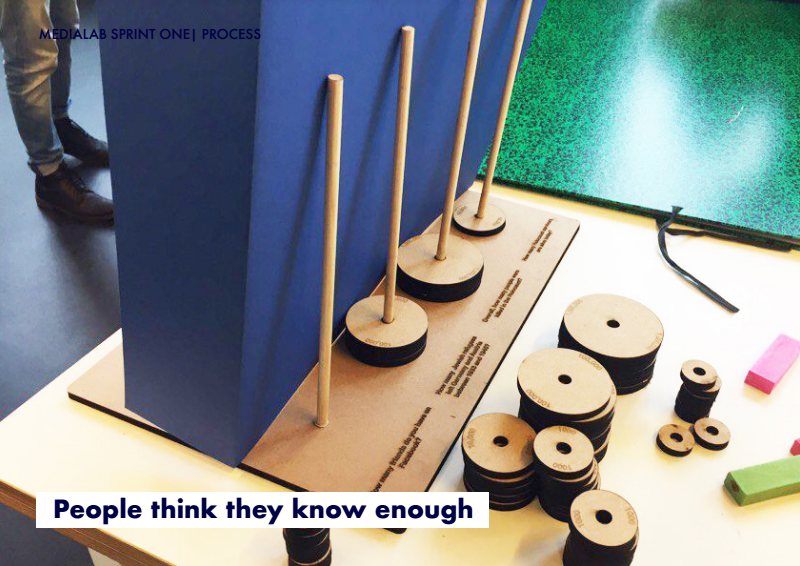
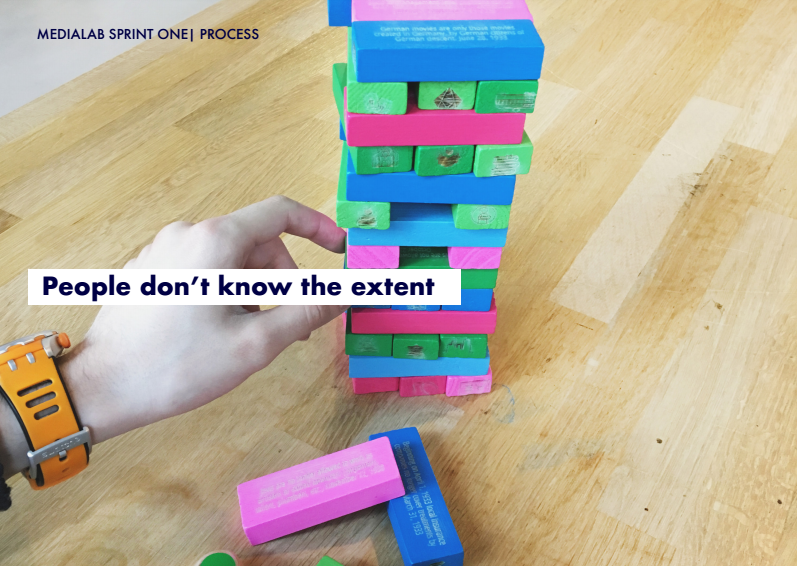
We started off with the idea of a map of the world, where one would see the geographical locations of the partner institutions and various connections between them. However, it felt like this visualisation would not be informative enough. Eventually we came up with a hexagonal grid, where each hexagon represents a single partner. Each hexagon has a small logo of the institution’s building, and on the opposite side there is a QR code. By scanning the QR, a user can get detailed analytics of each institutions influence and public engagement. An Android app was made to scan the QRs and display the information.
The app was built with React Native
This visualisation might also serve as a research tool in the future – by asking different partners to arrange hexagons based on their relations with other institutions we could gather information on how people view the network from within.
Online Connection
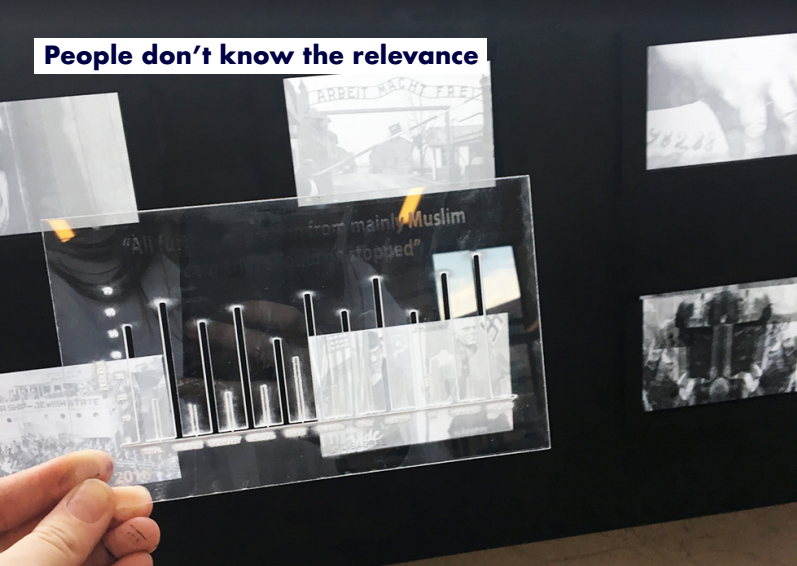
Another thing we did was create a visualisation of the way partners are connected online. By scraping each partner’s website for links leading to EHRI and other partners, we were able to make a representative graph. It was interesting to see that some of the prominent EHRI partners barely mention the network in their materials.
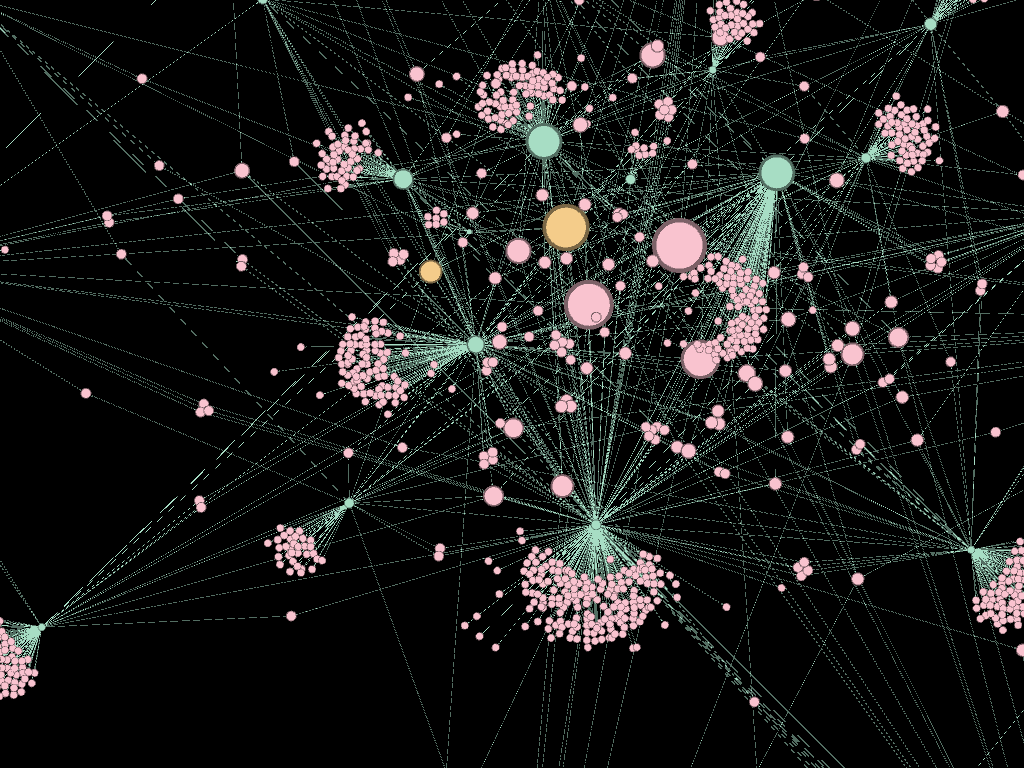
Beautiful, isn’t it?
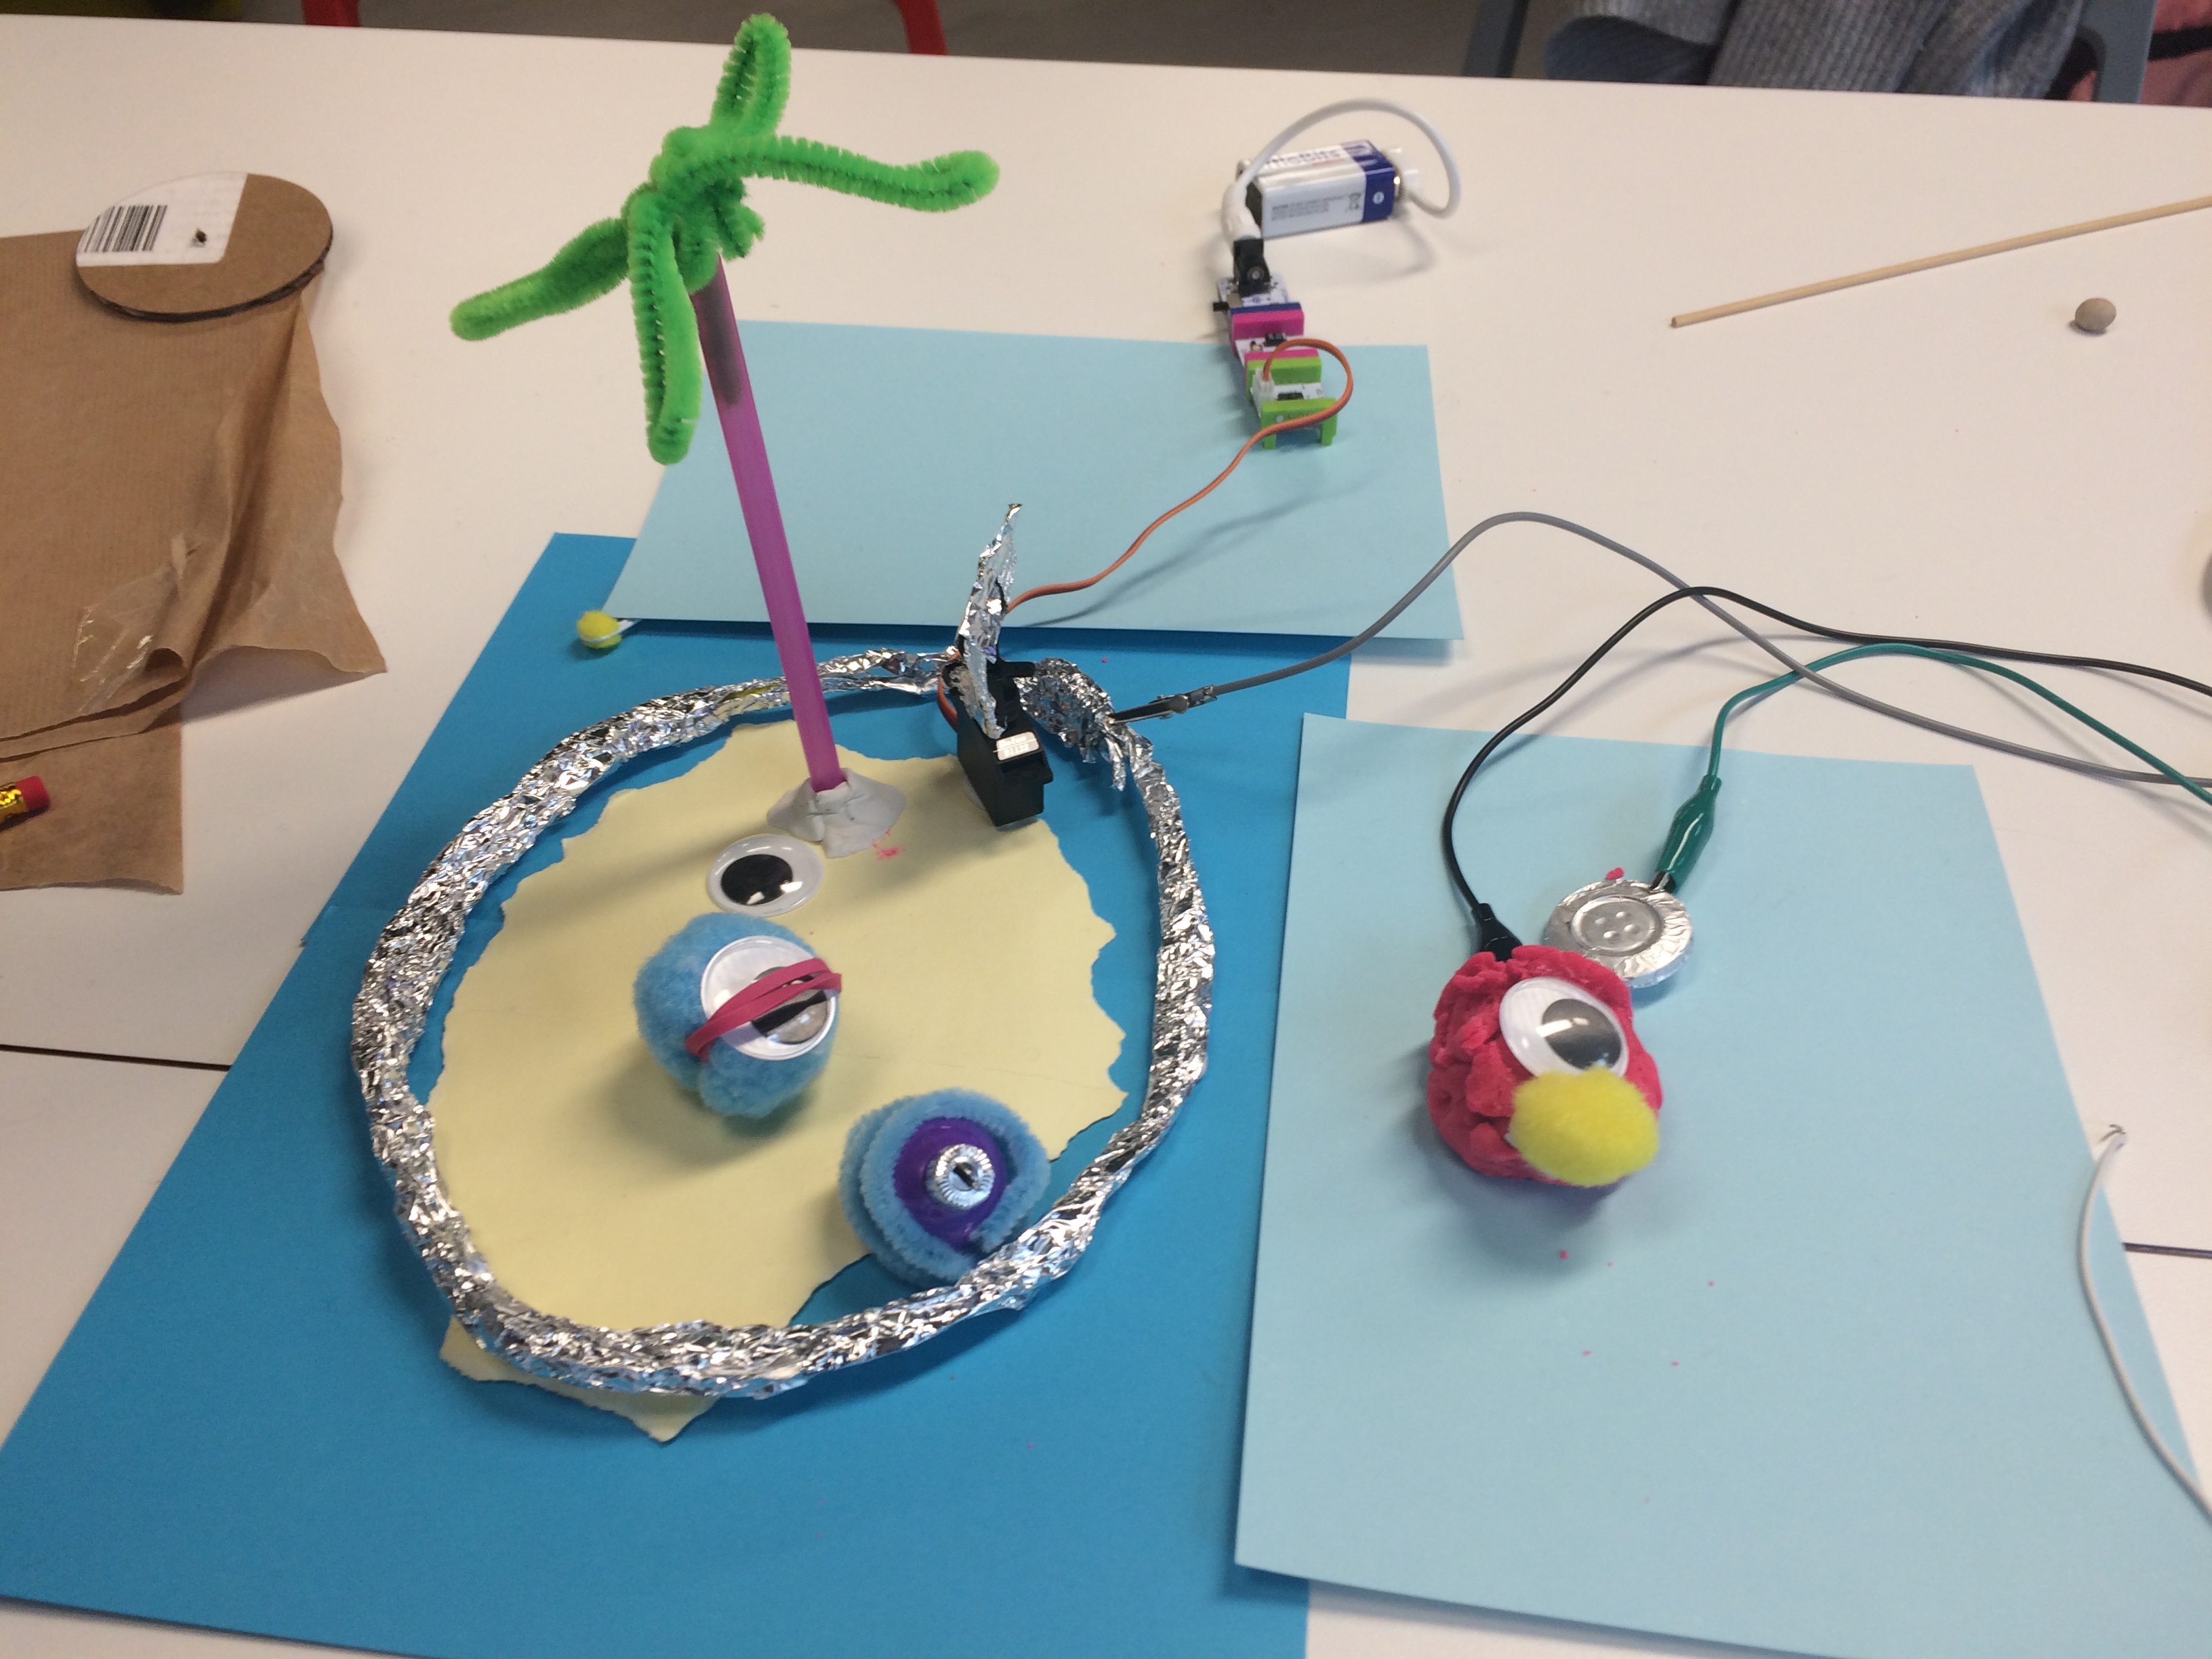
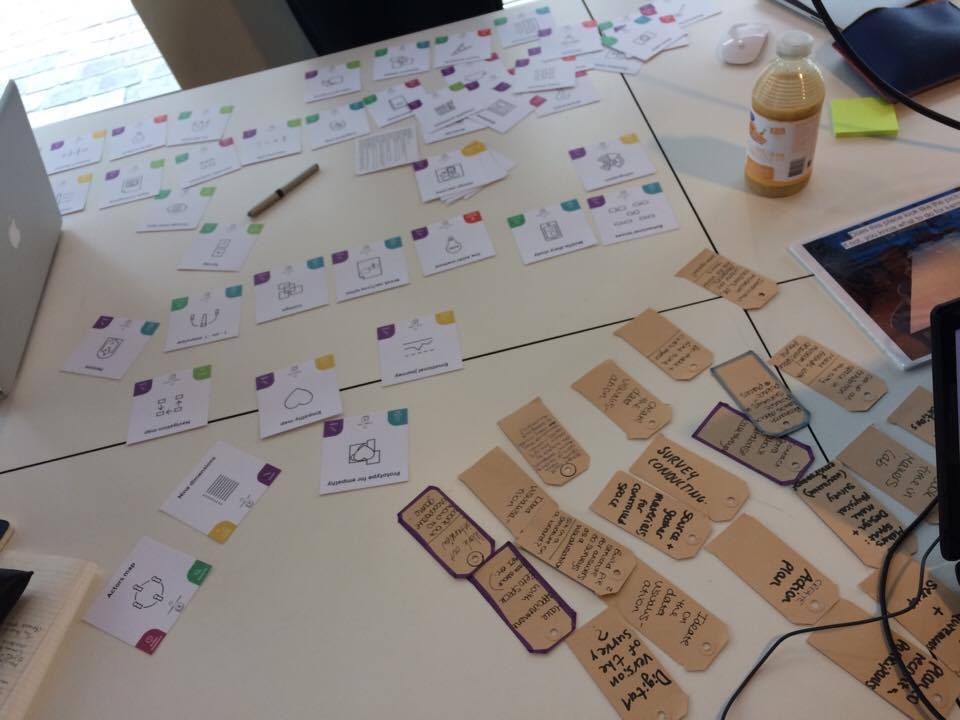
Prototyping Workshop
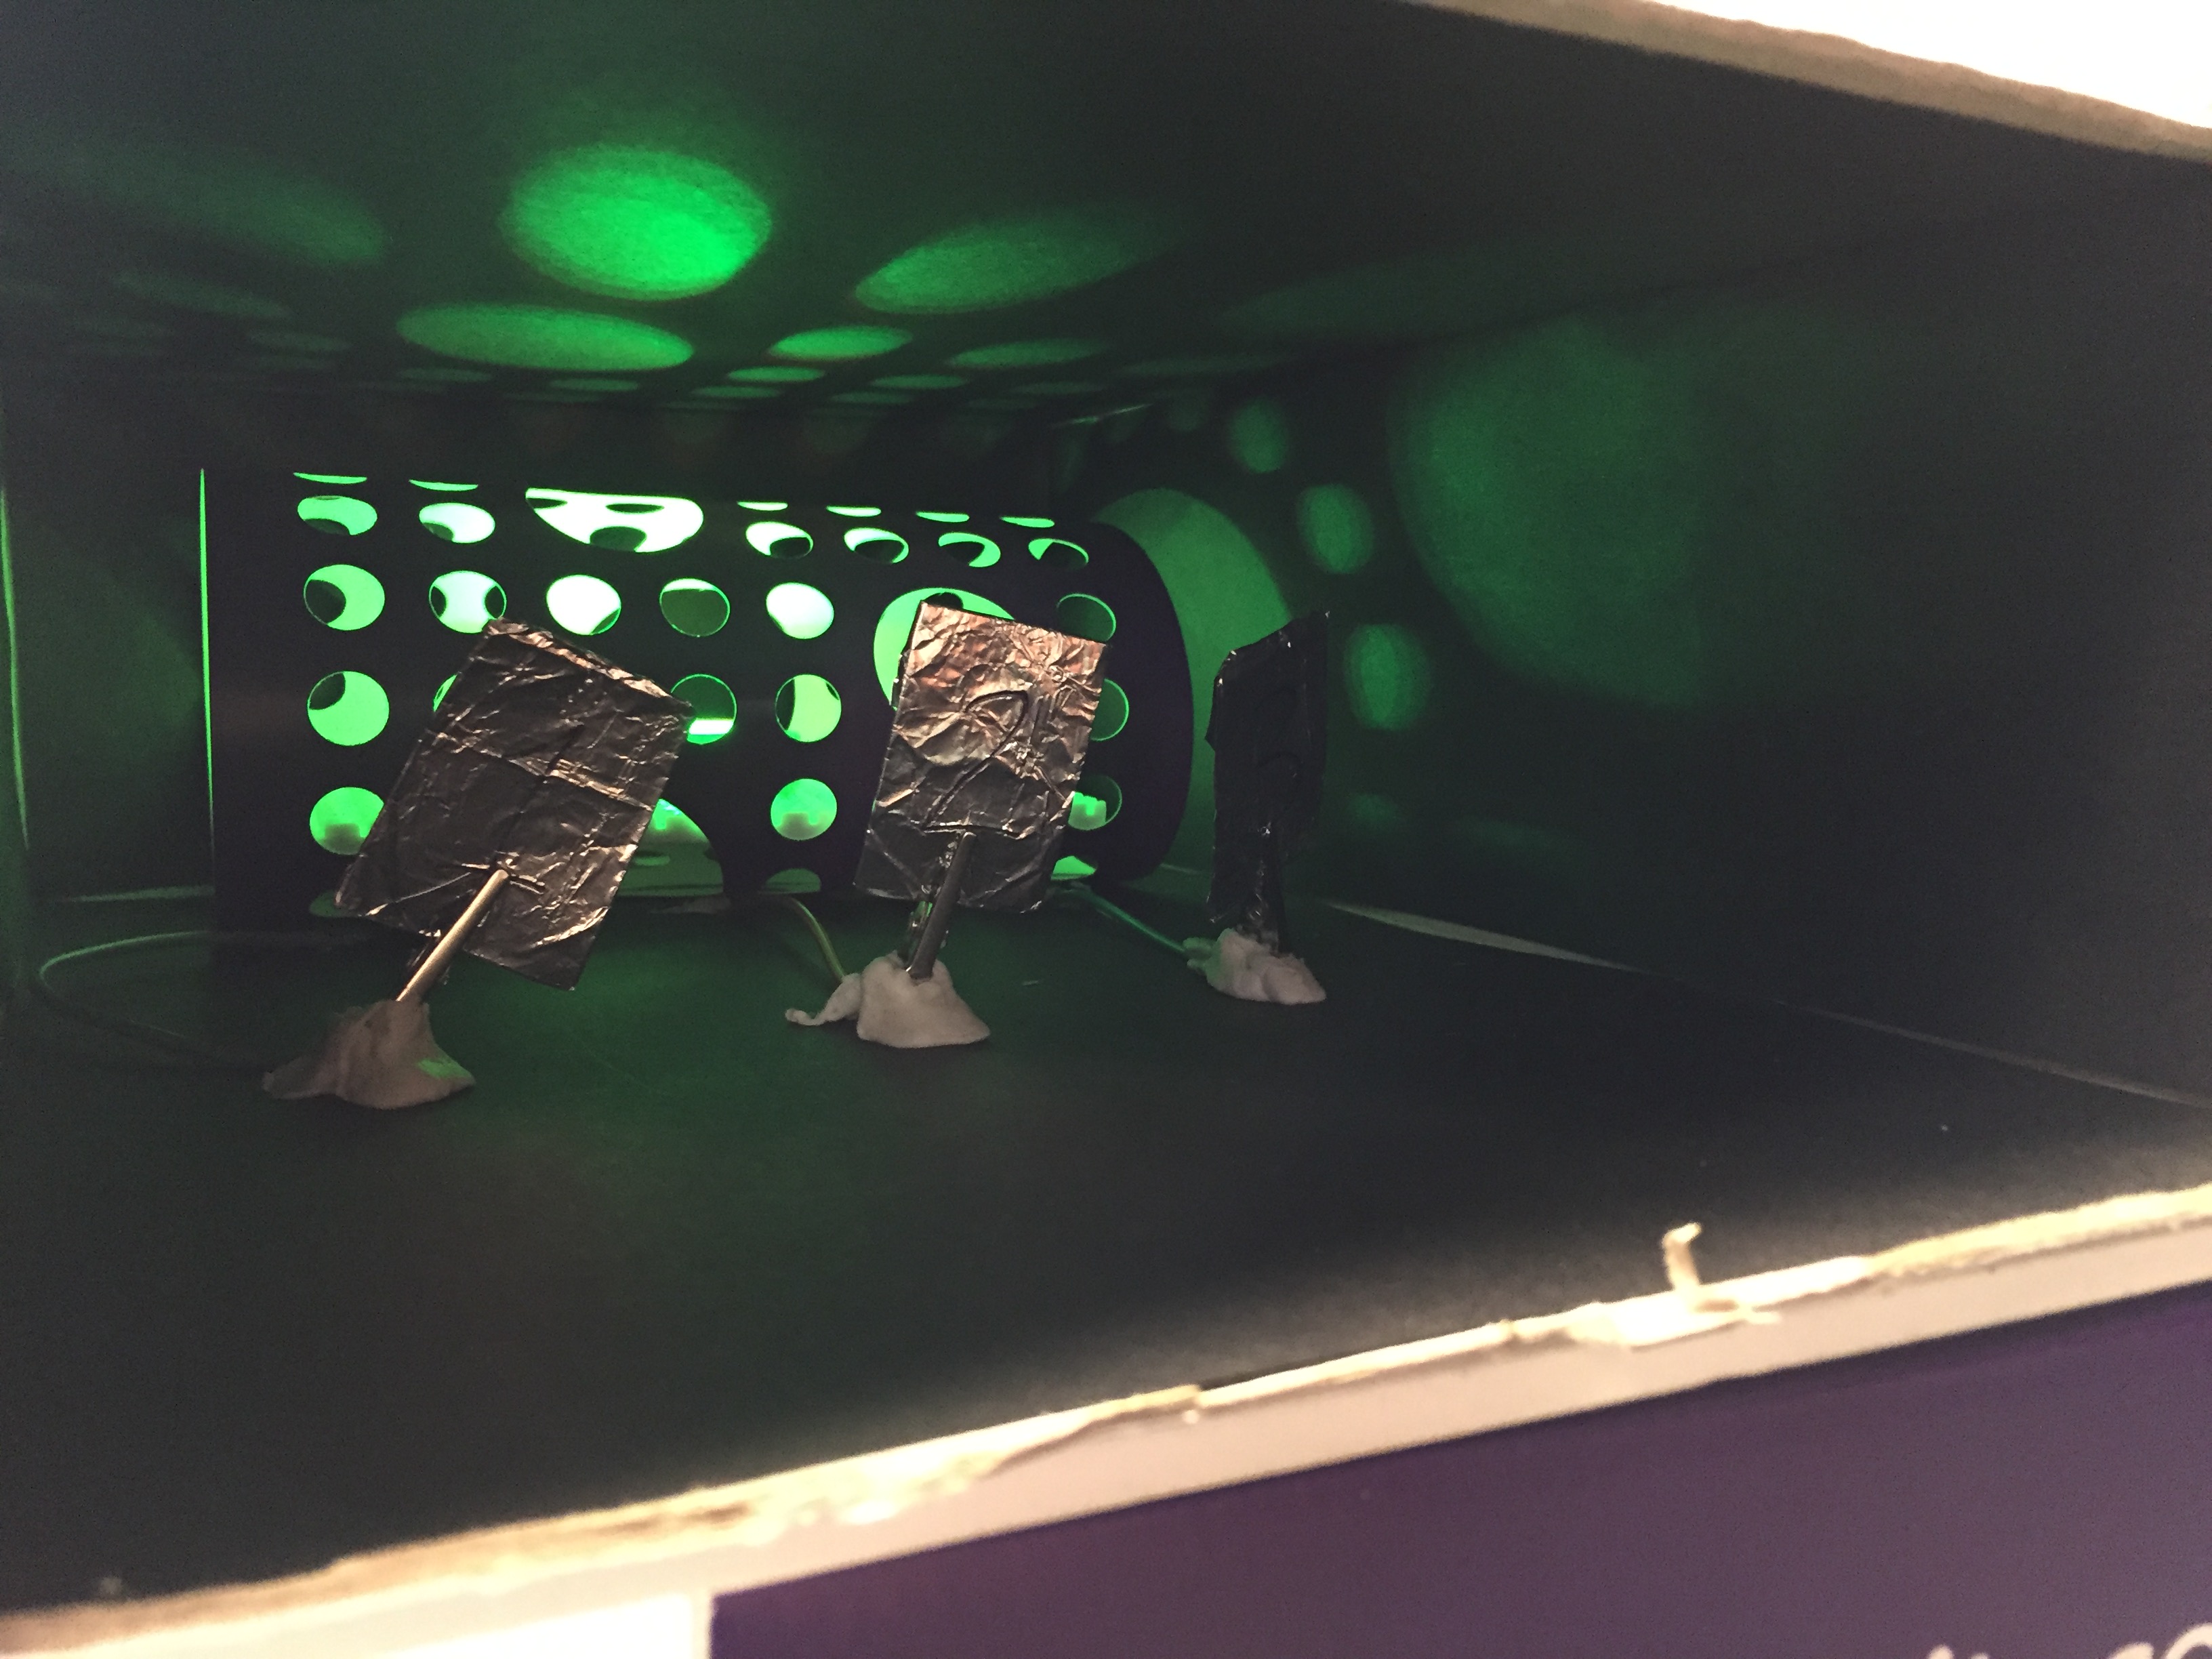
We also had a workshop on various types of making prototypes – from paper to Wizard of Oz and role playing. As an exercise, we created a demo of an interactive exhibition space, where people could watch documentary footage of the Holocaust, see people in other EHRI institutions watching the same materials, and leave their thoughts and impressions to be seen by other visitors. This workshop was useful to think about what we could come up with for our end product.
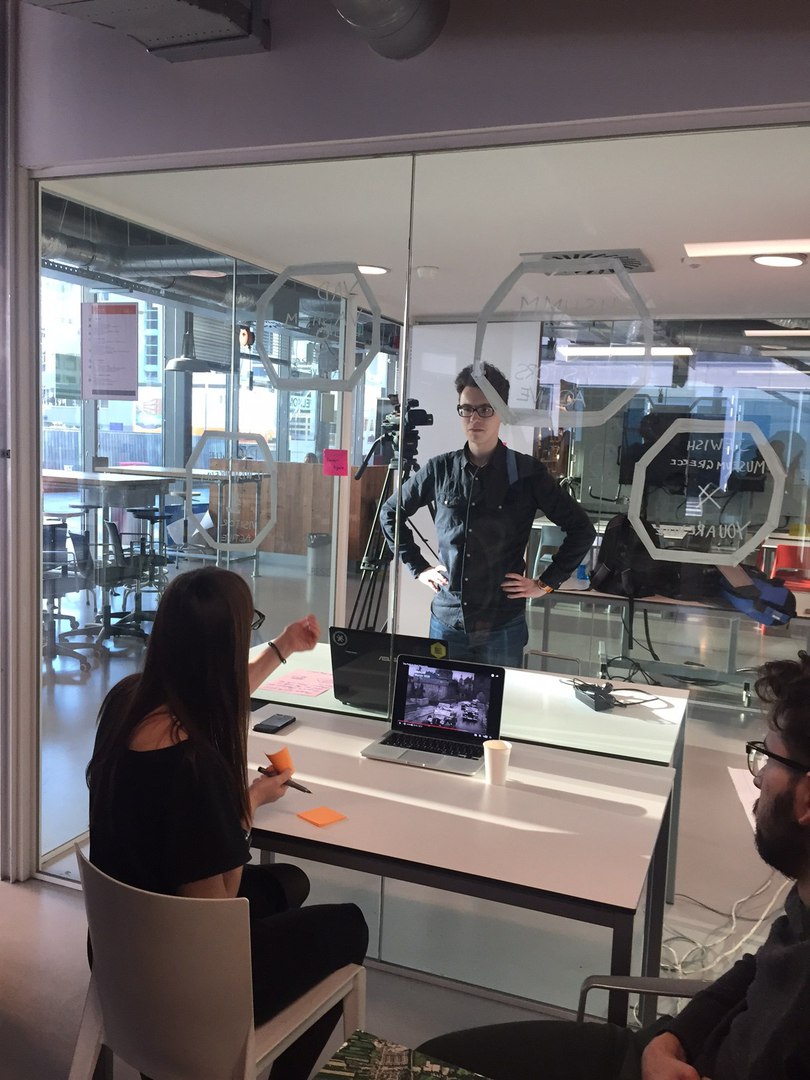
Grace Houghton and Bogdan Moroz demonstrating the prototype
Sprint Review
EHRI appreciated the data that we gathered and enjoyed interacting with the prototypes that we made, and the resulting discussion provided us with more insights about the network. We did agree that the goal of our project is not to focus on facilitating connections between partners, but to address a new wider audience. However, the gathered information will be of great aid to our further prototyping and research.