MediaLAB Amsterdam is now the Digital Society School! You are viewing an archive of MediaLAB projects. Content on this website may be outdated, and is without guarantee.
All knowledge and findings from the last five sprints comes to this one. We saw evolution of ideas: how they were born, changed, merged with others and what became of them in the end. The final prototype is a representation of the best, most robust and innovative ideas that withstood tests of time, criticism, various prototype sessions and hours of discussions. This blog post will be about this.
Prototype
The prototype itself is a journey with a scenario that changes users’ behavior. Although all parts of the concept can function on their own, it’s best to look at the whole image from the perspective of a user. It all starts with a detailed, but bite-sized information about person’s current and past energy usage. From there, user is directed to insights page, that give personalized tips on how to lower usage. After implementing those tips, user is informed, how she/he had grown as an energy user and where does he stand in the leaderboard of sustainability among other similar companies. To make even bigger impact to help lower company’s energy usage, we came u with a concept of a public screen, where information about usage is hsared in public spaces. It brings knowledge to employees together with the tips, how they can participate in cutting down costs. It is important to notice, that all parts of a user journey is personalized and as relevant as possible to the time and situation of platform usage. For example, if a user checks insights page during the cold season, he will only get tips on how to isolate building and cut down heating costs. Nothing will be mentioned about air condition, etc.
As mentioned, these concept were cumulative knowledge of previous sprints, but we still needed to test the whole concept. And we did just that.
Testing
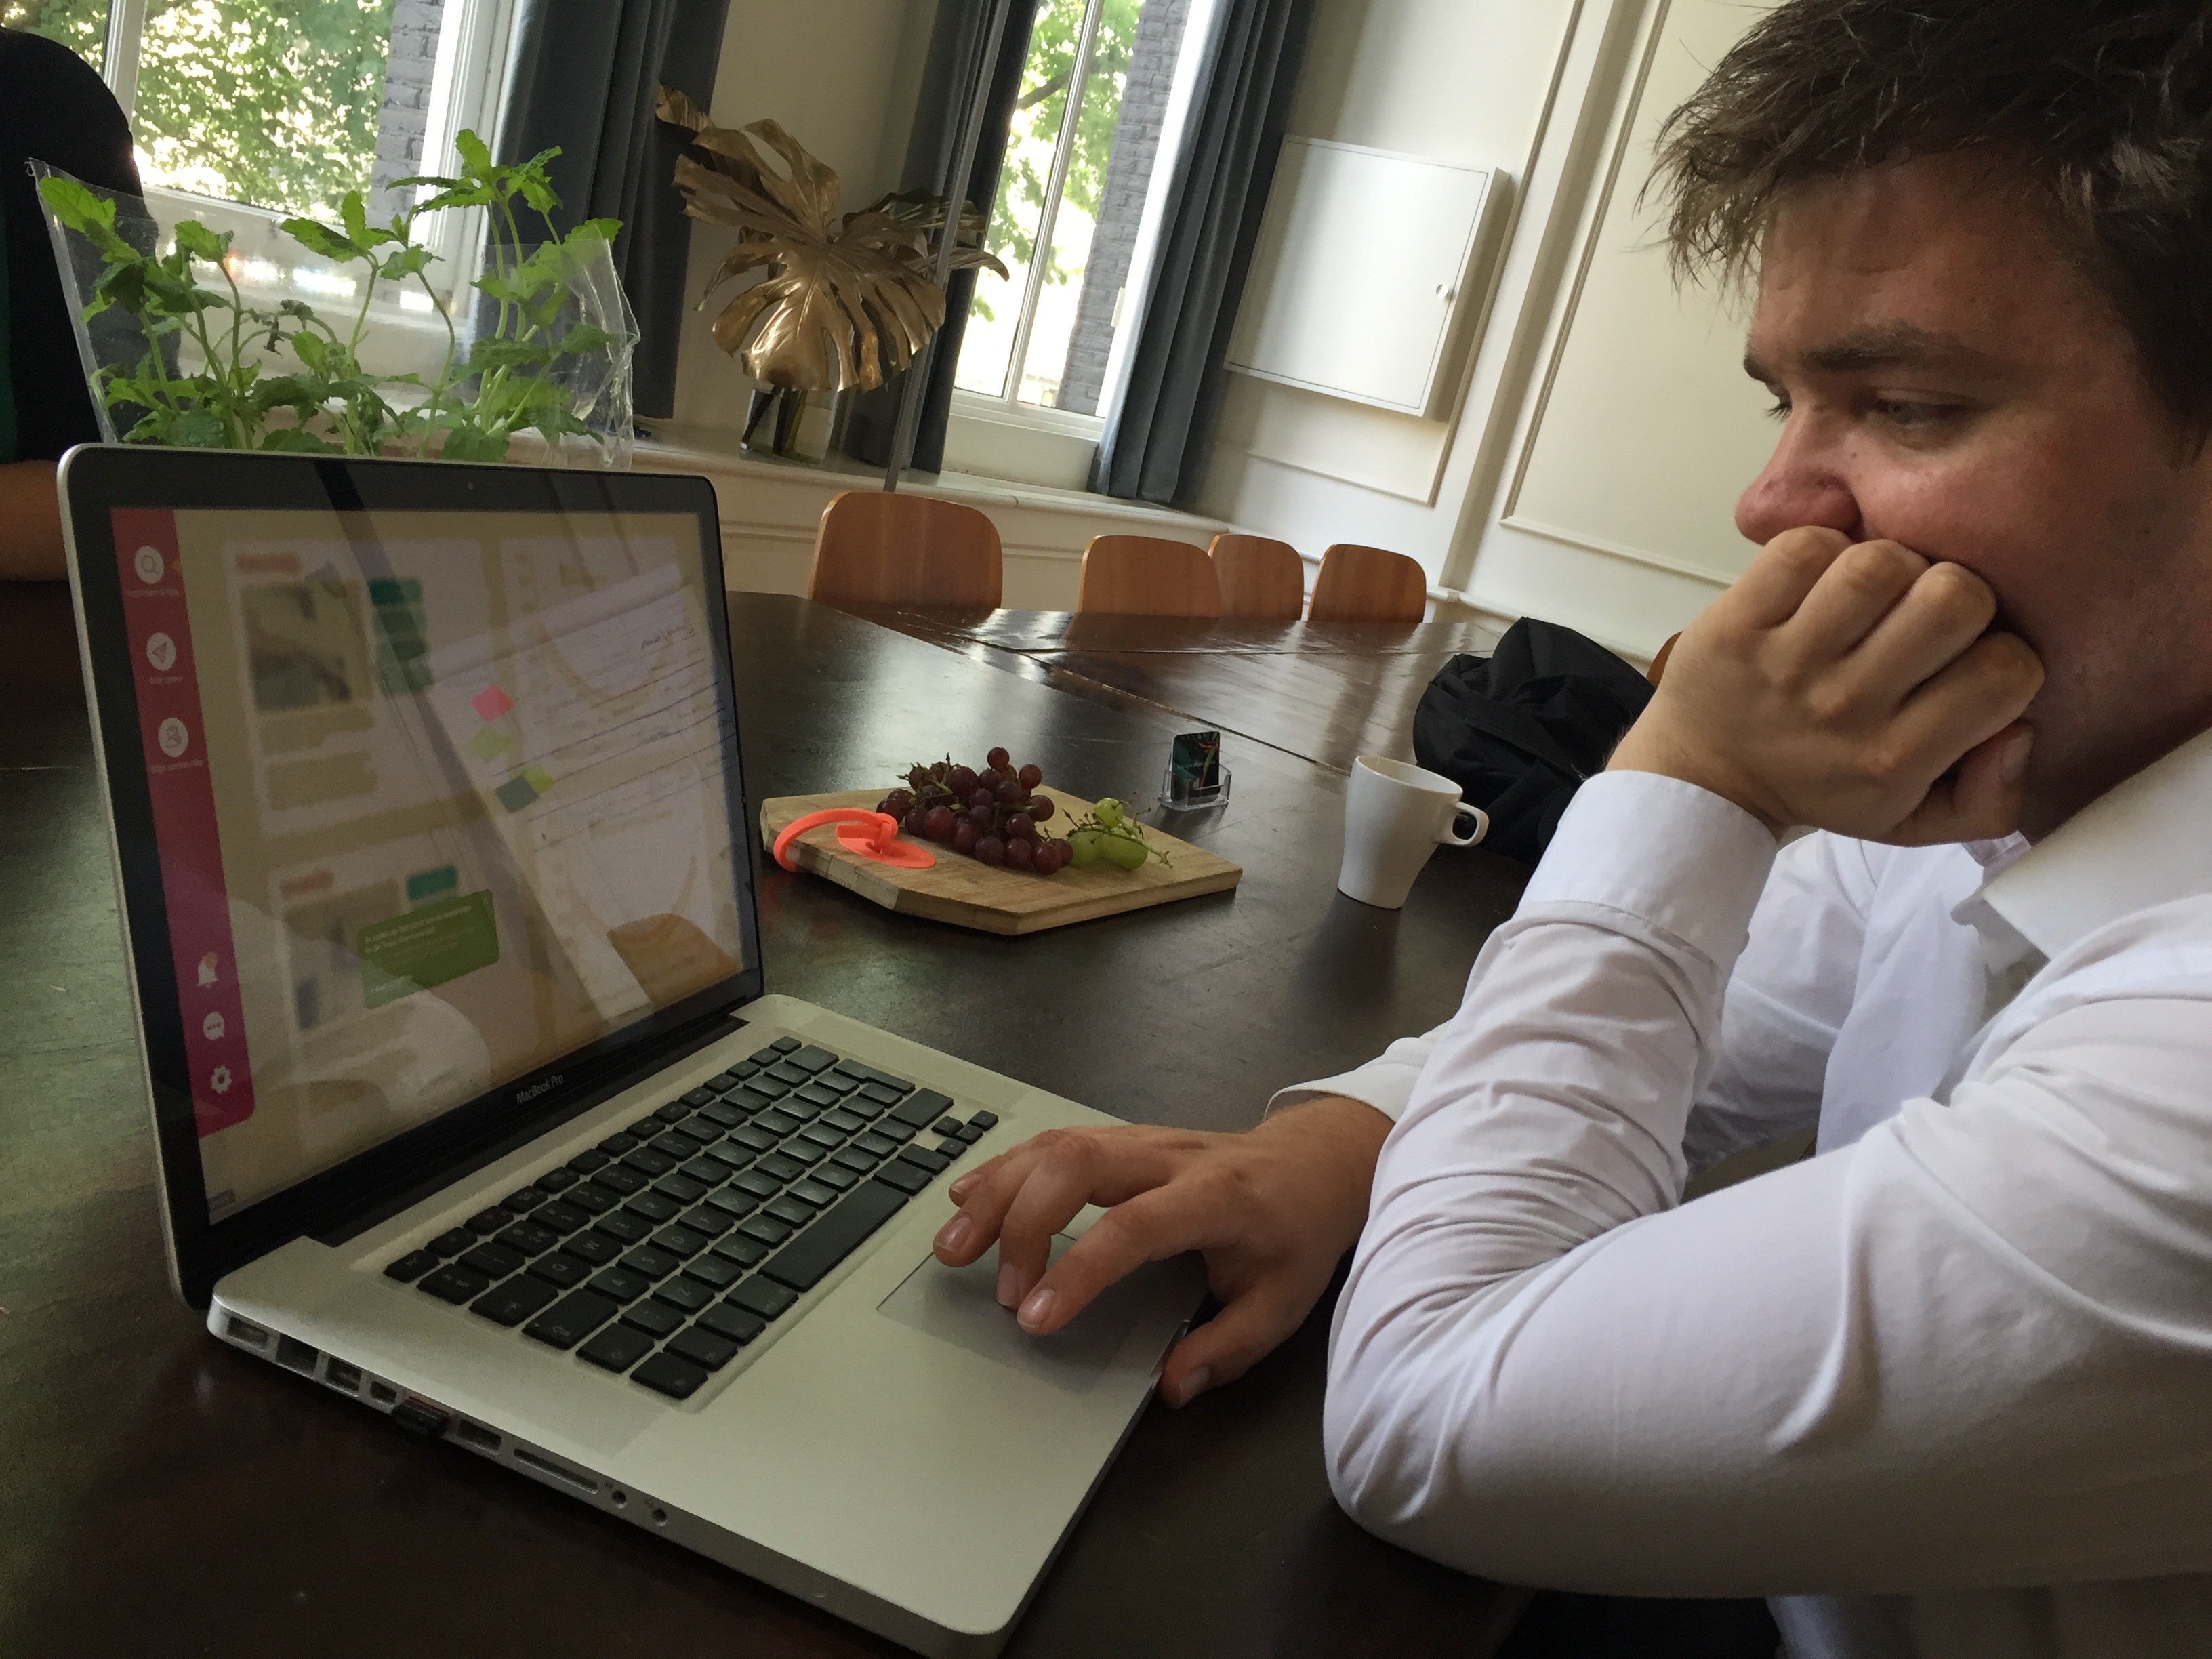
In cooperation with Beekeen (Eneco’s partner in finding respondents) we held a testing session of two hours with five people from our target group – purpose driven community leaders. Each part of the concept was discussed in length, no stone was left unturned. Overall, target group liked the idea, it resonated with them and their needs, and the concept in general, they found it understandable and gave extra ideas for future plans. In short, we received a long list of small design improvements and suggestions for further development.
At this moment, 8 days before the final presentations we are busy with the research paper and the research poster. We made a movie to show on the 22nd and are collecting and documenting all the research, feedback and future possibilities for Eneco. Grab some popcorn and enjoy!
Last sprint we finished with a testing session which was a success. We started this sprint with a lot of feedback from the target group and our coach. The goal of this sprint was to implement all feedback and find a better way to apply the three focus points which were:
Understandability,
Call to sustainable action, and
Transparency to create trust.
Prototype
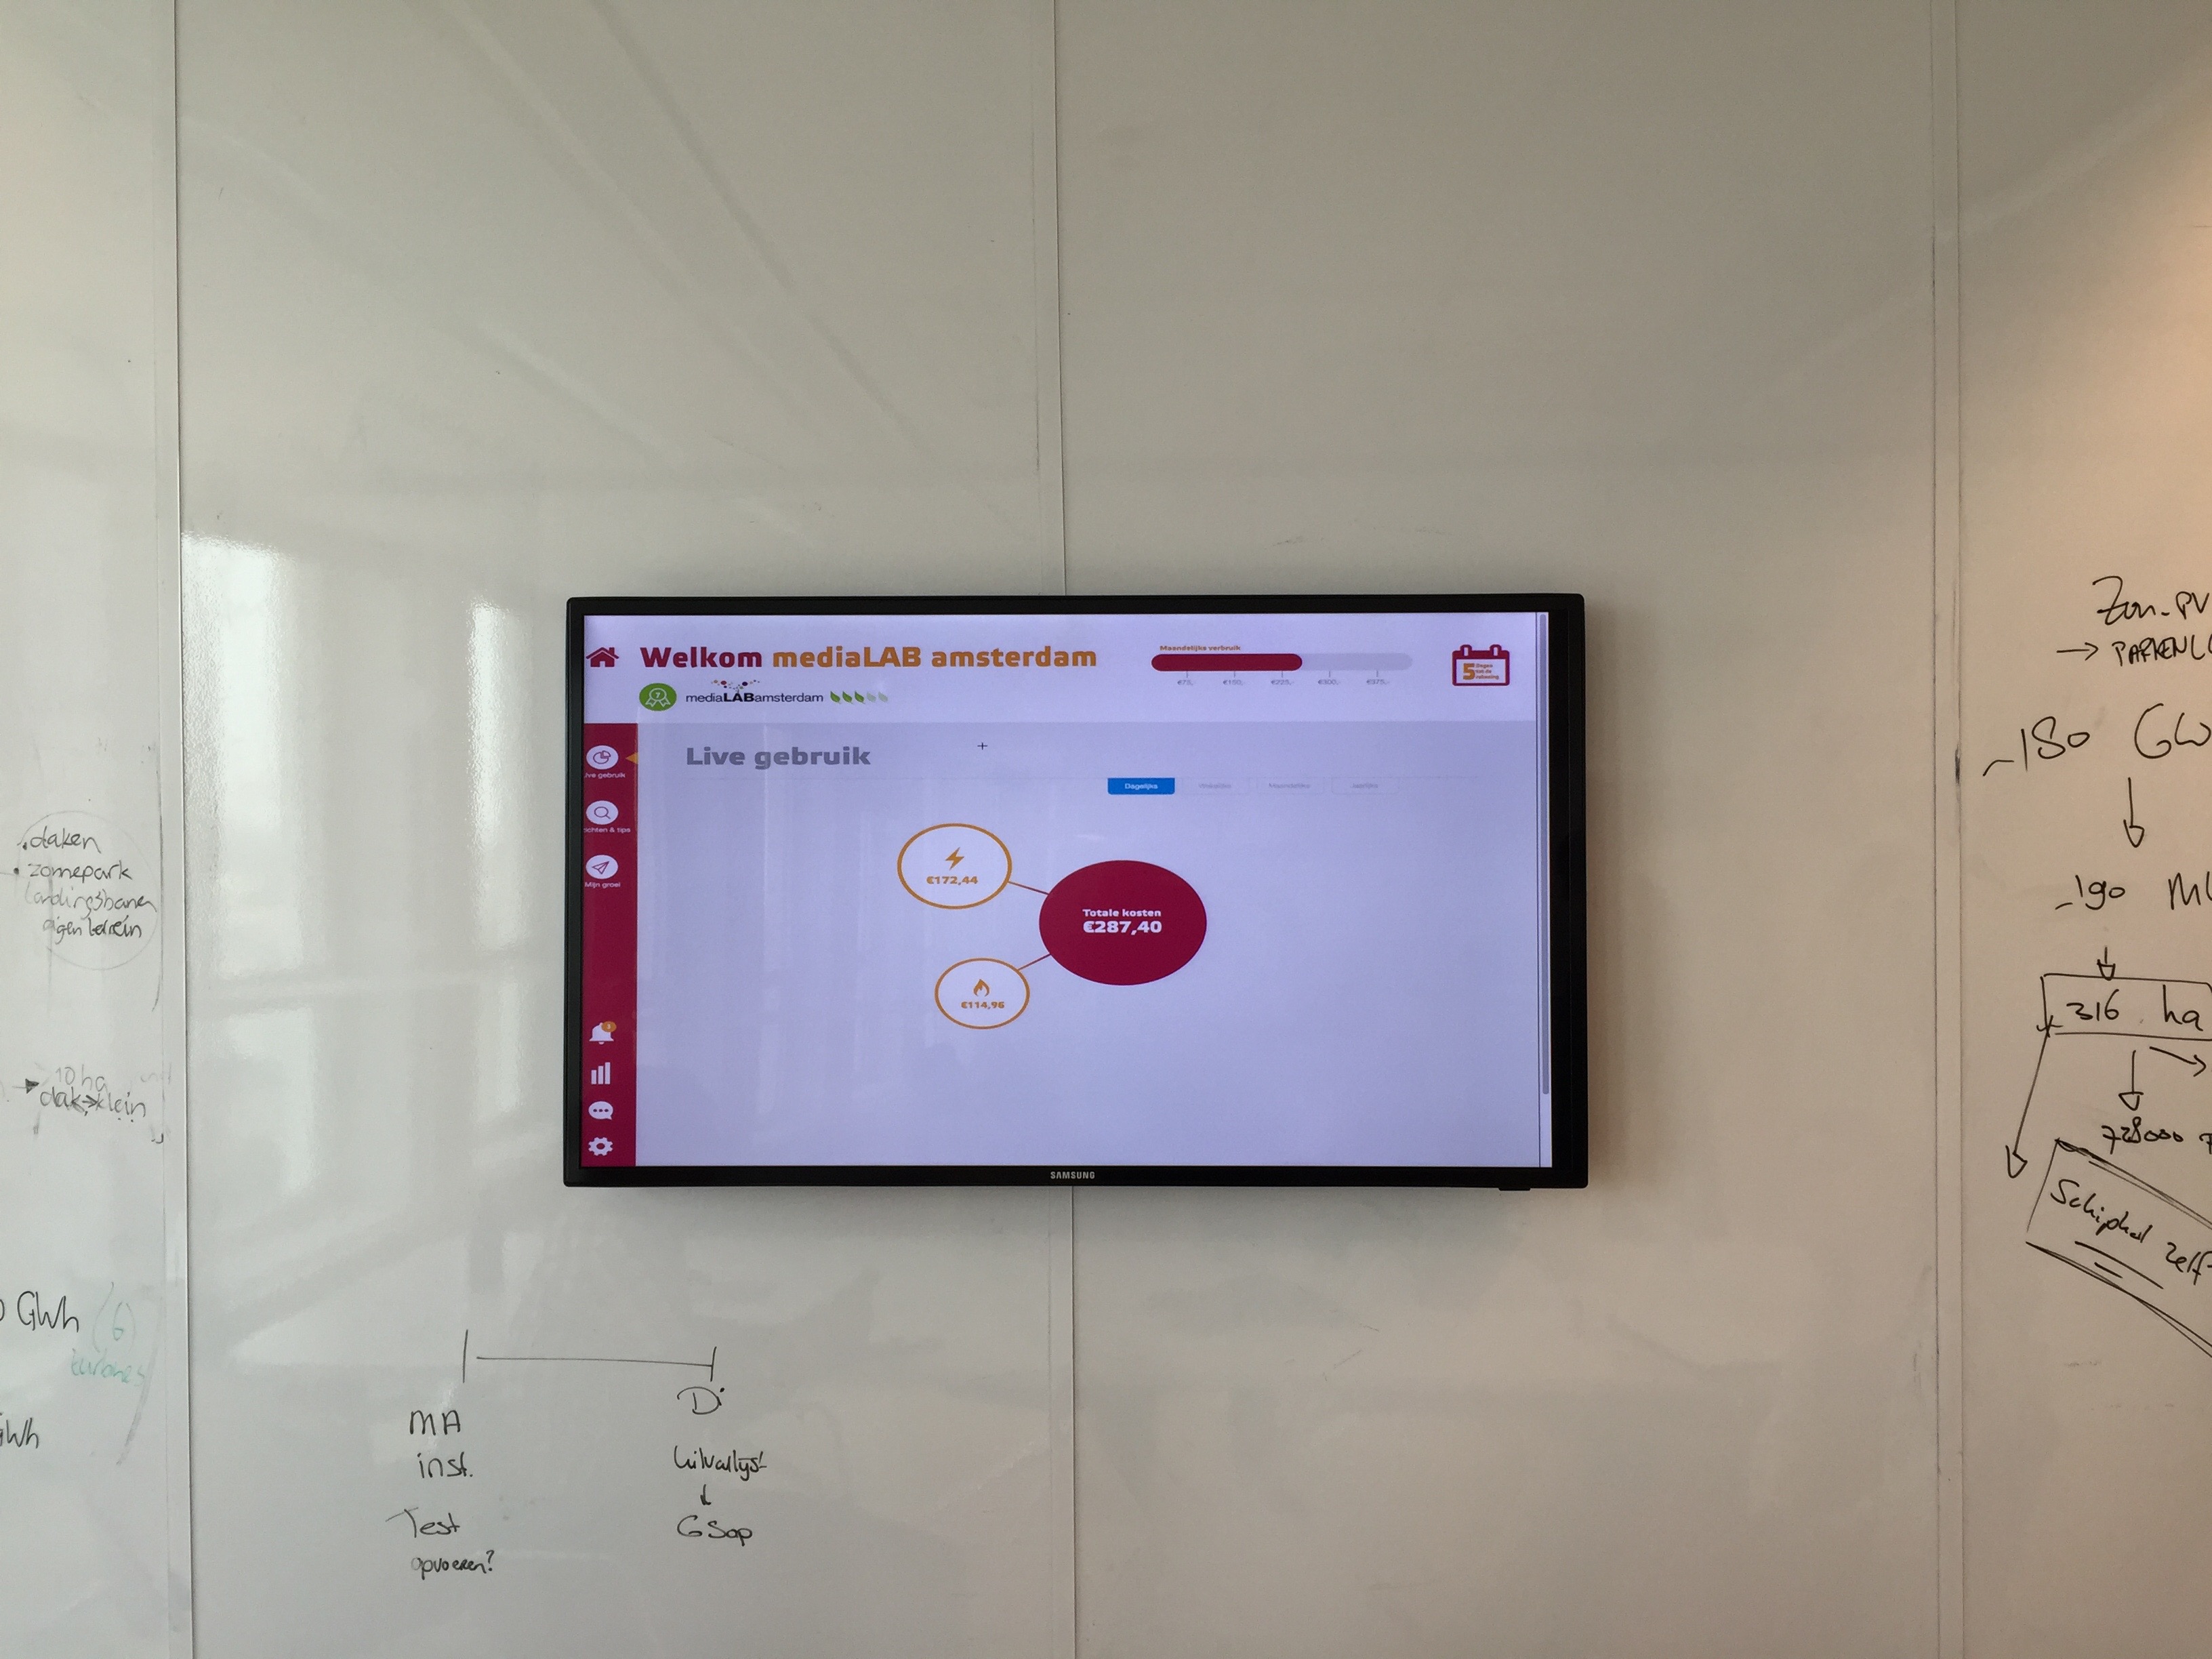
During the concepting session we cut our previous prototype and feedback in pieces and rejoint them in a new way, looking really critically at it. Visually we have something really different at the moment then in the previous sprint while the story stayed the same.
We started with looking at different webdesigns to gather inspiration for our own. Then we started concepting about the main elements of the screens and paper prototyped the screens one by one. These were then turned into digital screens by Thierry.
Feedback
During this process we decided to ask for feedback to reassure us that we were going the right direction. We set up a session with our coach and two other MediaLAB interns whose professionalism is web- and interaction design. Again, we got lots of good feedback which we implemented.
As this was a big task we were thinking to expand the sprint, making it a 4 week one, but at the end we decided to not to do it because the goal does not change. In Scrum you can mess with the sprints when you see that you are not heading the right direction but this was not the case.
So sprint 6 will be all about finishing up the prototype and testing it.
After we finished the paper-prototype of Sprint 3, and got some feedback from Eneco, we started with doing research again. First, we went to the floor of the Customer Service Department here at Eneco and asked around what the frequently asked questions were about the bill. We soon realised that the documentation of the FAQ wasn’t that detailed so we knew now that we needed to look deeper. We contacted a Kenniscoach from Eneco and talked to a few employees that talk to the customers on a day to day basis to get to know what the detailed questions were. We noticed that they were very busy so in order to get more information we made a small form on which they could fill out their Top 3 and gave them a few hours to fill them out. We also tried to do something fun with a whiteboard on which they could write the FAQ’s with a cookie as a reward but that did not really work, unfortunately.
After this we had a meeting with Maartje and Ursula to inform each other on our findings. This was very helpful and gave an extra direction towards our goal.
Prototyping
With all this in mind we first made some individual prototypes to be able to explain to each other what our, individual, vision was. We noticed some patterns and some very original ideas and decided to vote on each other’s designs to make a combination of it all. By doing this we were able to decide, in a democratic way, on which direction to take and start prototyping.
Thierry and Antónia focussed on the actual design while Rokas and Laura were busy with creating the content for the new digital environment in which the bill was going to be depicted. This was actually a very efficient way of working.
Co-Creation Session!
Luckily, with the help of Beekin (a company that is specialised in contacting respondents) we were able to set up a session. The three main focus points of our session were going to be:
Understandability
Call for Sustainable Action
Trust / Transparency
At the beginning of the session we first introduced ourselves and tried to explain what the intention was of our Clickable Prototype (Invision). After this all our respondents (5) were able to explore the prototype individually and give some feedback and this was followed by a collective go-through where we could explain all the different aspects and ask for feedback. This worked very well but of course we also got some feedback regarding the fact that not everything was working already… We noticed that the TG really expects something finished instead of just clickable. So that’s something that we need to explain better the next time.
Feedback
We got a LOT of feedback from our Target Group and when we presented all this to Eneco they also provided us with a lot of information that they gathered from their sessions. So with all this information we are surely able to create an even more kick-ass prototype than we already had.
In a sense, Sprint 3 is a continuation of Sprint 2. Diving deeper into the target group’s needs and wants, getting to know it better, but also focusing on the whole experience journey and what insights this journey might bring.
Our goal for this sprint was to create concepts based on a co-creation session (with tiny-tidy office decision makers based on their energy consumption experience).
Brainstorm on steroids
Sprint 3 started with the realisation that after doing the interviews we still did not know enough about the TG’s needs, wants & values. Especially around the subject of their complete user journey. Now we only asked questions surrounding smart technology, privacy and sustainability. We concluded that there was a bigger picture: the fact that Eneco wants to change it’s image from a commodity business to an advisor role. Eneco is now in transit towards a company with ‘followers’. So we actually had to create a service that would fix the biggest pain point for the TG to create some kind of a, trust-based, relationship. And a relationship is based on transparency. To find out about this energy consumption experience, and their emotions with it, we thought it would be fun to set up a co-creation session. We started making a cultural probe together with trying to set up the session. The idea was that with the probe we would ‘warm them up’ for the session so that our respondents would have some basic information ready for us.
In the probe were methods and tasks like describing your energy consumption daily, weekly and monthly; listing sins and commandments of your energy company; describing your perfect employee, business-partner or advisor et cetera. With this information we would have some data that we could discuss during the actual session itself. We were planning on doing a brainstorm session and discuss why they answered the way they did. With the ‘actual’ journey and the sins/commandments method we would be able to find out the emotions and reasons behind the pain-points. With the ‘describe your…’ method the idea was to find out how the entrepreneurs wanted to be ‘helped’ with their problems. As an advisor (someone on the background outside of the company), employee (someone who listens to you) or as an, equal, partner (someone ‘inside’ the company).
Time is money
Just as in a previous sprint, contacting the target group proved to be a challenging task. And it was even more difficult this time, because not only did we need to find 5-7 CEO’s, interested in doing an interview, but also make sure that their schedules were aligned to have a joined co-creation session on a specific time, date and location. It took around a week to prepare the invitations, find and contact 60+ companies. And the result of all of this was insufficient to have a worthwhile co-creation session. Having 2 respondents was not representable enough to make decisions about the whole target group. Therefore, we had to rethink our approach and further steps. .
Regroup!
So after we experienced a hard time because of the lack of respondents for our session, we took a few days to regroup ourselves. The information we wanted to have with the session was based on their energy consumption experience and user journey. We had a meeting with Maartje and Ursula from Eneco to plan out the upcoming direction. We collected some brilliant data that was perfect for us. The data we actually wanted to have by having a co-creation session..
Making sense of it all
We analysed the data and sorted out a place to fit in as an interdisciplinary group. Our coach tipped us on cutting down the whole user journey to zoom in on a certain element, instead of the whole piece. We analysed the interview-data Eneco had very carefully, and brainstormed on that for two days to regroup. We decided to focus on the “usage” part of the customer journey.
Be like Bill
The connection Eneco has with their costumer on the business field right now, is usually once per month with a bill. How this bill is presented right now is very static and detailed. After we analysed the interviews we discovered that there are some friction points here. It was too hard for most of the entrepreneurs to find the information they wanted to look at. If you see how the consumers are having their bill presented by their Eneco Home account or Toon mobile account now, it shows how much potential the ‘normal’ bill actually has. We took the challenge to start focussing on the bill and how we can design a new experience with this part.
‘Out of the box’-thinking
We decided to do some individual research & concepting about the bill so that we could come up with fresh ideas. Antonia focused on game design and found some really interesting stuff around the subject of awards and the ‘call to action’ part of the bill. This stuff could be implemented in the insight-part of the bill. Thierry tried to find solutions in design, such as putting the name of the company on the same level as the logo of Eneco to create some sort of ‘equal’-feeling. Rokas and Laura were primarily researching and concepting into how to create more trust and transparency into options and design. Such as giving the user more power in shuffling it’s own options and the aspect of finding information with just one click of the button so that it does not feel like Eneco is trying to hide something in the tiny letters. All these concepts were combined and categorized so that we could make a small paper prototype to present.
Quick and Dirty: a paper prototype
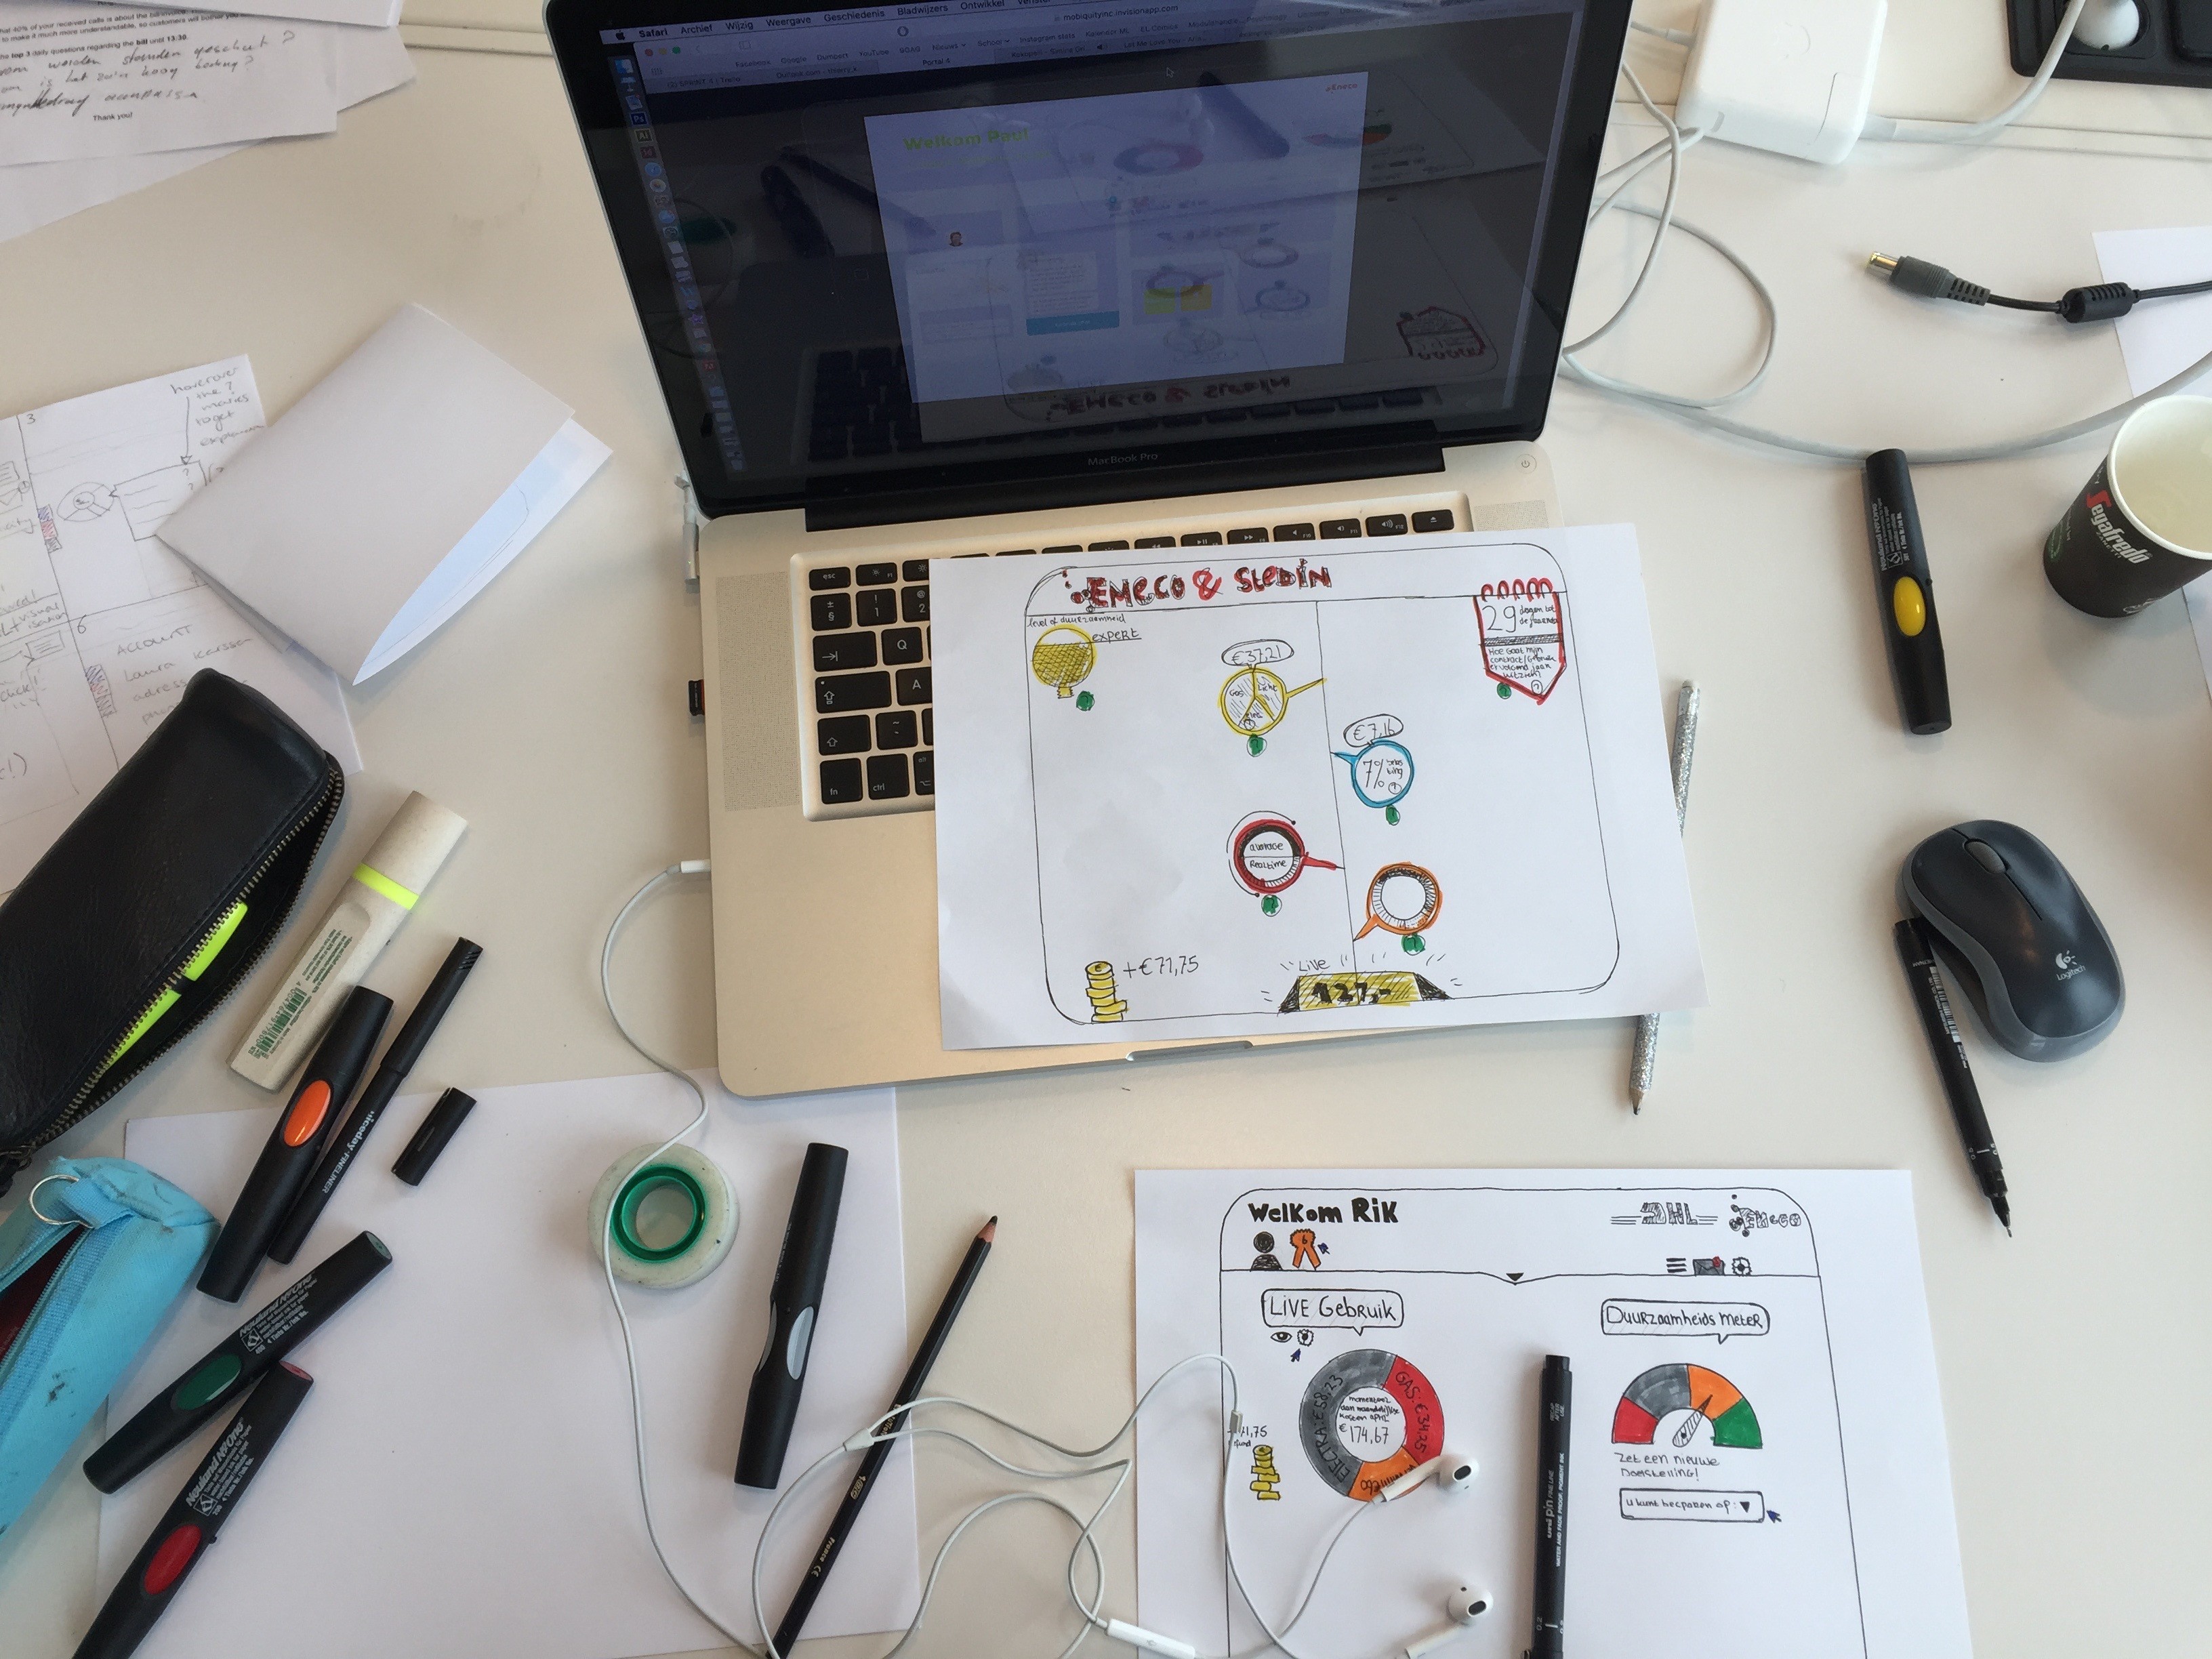
We had a brainstorm session where we looked at our individual concept drafts and research about how you can present a bill and it’s information in the best way. After this session we wanted to put the new concept in a paper prototype.
What are all the possibilities? We thought about functions and usability, et cetera. We started with making a blank internet browser where we put our first functions on; customisable info-templates, infographic-wise stats etcetera. We drew them on papers and put them on the sheet to discuss about that. This is a very early stage of course but we started by making elements concrete. We presented this in our peer review and sprint review at Eneco for further discussions.
Eneco really liked the ideas and gave us some further information, feedback and input to build on for our next sprint.
Sprint 2 was inspired by the need to know our target group and end-users better. To get into their shoes and see what they think about smart technology. To achieve that, we created a following sprint goal: to define TG needs, wants & values by interviewing and testing prototypes to be able to build further concepts.
Good questions are 99% of the interview
We started this sprint with the idea that we did not know enough about our Target Group. So we decided to start with figuring out the TG’s needs, wants and values by doing interviews with them. Laura already made a list of possible Interview questions for the sessions so coming up with questions did not take that much time. The questions were, generally speaking, mostly about: sustainability, smart technology, privacy, functions & usage and the prototypes that we made in Sprint 1. We’ve noticed that it’s very hard to create open questions, so that you don’t influence the respondent, and be clear/explicit at the same time.
Contacting TG: it’s all about networking
Our target group was tiny tidy office decision makers and CEO’s. It means, that arranging interviews is a huge activity on it’s own – business people (and startups especially) are known for their lack of time and interest to anything else, than their business. Therefore we contacted a number of companies through different channels and sources: personal connections, Eneco target group list and even meetups. The whole task of contacting and arranging the date and time took about a week, but we succeeded in finding 6 willing respondents.
The art of interviewing
The second week of the sprint was full of interviews. Starting on Monday and finishing on Friday. It took a lot of energy and effort but was a lot of fun. Getting out of your comfort zone and really trying to start up a conversation or discussion about energy usage was very fulfilling. Also actually talking with people from our Target Group was satisfying, now we could really start getting to know the users that we were designing for. But, we also noticed that it was hard to get concrete answers from our respondents without influencing them too much. That balance was very hard to keep.
Uncovering patterns
Analyzing data started by transcribing interviews. When we had it written in text, we highlighted answers and insights that were relevant for us and interviewees – we made sure to find the major insights as objectively as possible without “cherry picking”. When we all became familiar with the content of interviews and started to see patterns, we tried to categorize ideas and insights using post-it notes. This method proved to be effective in organizing huge amounts of subjective and qualitative data and making it understandable. Next step – visualising it.
Show, don’t tell
After we transcribed the 6 interviews we started to make the raw data for the infographic to make the results visible. We looked at the transcriptions and did a session with the whole group where we divided the results in different topics. We used post-its to make the first structure.
After filtering and connecting the insights, we made nine main insights and requirements for the concept. This was actually the wireframe for the infographic. We started after that by creating the graphic style and layout of the infographic. Its been made in portret perspective with yellow as primary color and black, grey and white as secondary color. The most attention the infographic needed to have was the title and the nine main insights. It’s been designed on A2 format.
The concept of the graphic is sort of a flow-chart where you can follow different paths to certain information from top to bottom using circles, lines and rectangles. The title is very catchy and good to recognize from a distance. It has the main attention. Below that we define our target group. The main insights are connected with each other and they also have a few small quotes that we took from the transcripts.
Under the insights you will find three categories; data & privacy, medium and feedback & functionality. These are a summary based on usability of the potential concept. This was gathered by doing our prototype testing during the interviews. Overall, we found 9 major needs, that interviewees related to, but we know that there is much more – we just need to find them!
Three weeks ago we started our first sprint at MediaLAB Amsterdam. Our partner is Eneco, an energy company in the Netherlands. After our first meeting we already realised that Eneco is really trying to change their reputation and wants to make a transition from a commodity based company to a more service based advisory role. They want to advise and help their customers with making choices about everyday use of (sustainable) energy.
The idea of our project is to create a smart technology service to be of help for their target groups. For now they’ve already developed the Toon – a smart technology system specially designed for the home situation. Now our project revolves around implementing this system into the workspace.
For this sprint particularly we focused on the “fun & easy” part of the design of a system to make users engage more with the service. Because, when users engage more with a product, they will get more loyal towards the brand that provides it. And that’s exactly what Eneco wants.
Phase 1 – Research
Our target group is Tiny Tide Offices (TTO), that are mainly information, communication and consultancy agencies and shared offices: hubs, incubators. TTO companies consist of less than 10 people and 60-70% are 1-person companies. It means that there could be a lot of opportunities throughout the day for direct interaction with the smart system. We looked at game and fun theories to make the whole interaction enjoyable.
Phase 2 – Fun and Easy
Fun can be researched and that is what we did. Here are the results:
There are different types of fun divided into 4 categories:
Challenging fun – objective, awards, strategy, frustration.
People fun – generosity, niche interests, competition.
Easy fun – surprise, discovery, curiosity, content.
Creative fun – creativity, personalisation, avatars.
We decided to concentrate on the last two – easy and creative fun for several reasons. First, people in the business sector are more interested in their own progress, rather than how are they are doing compared to other companies. Therefore, competition-people fun was out. Secondly, the challenging fun was more related with gamification and required plenty of interaction with the whole system to completely experience this kind of fun. We made three prototypes to test whether easy and fun elements would increase engagement based only on easy and creative fun elements.
First round of prototypes
To test our sprint goal hypothesis (that fun elements increase engagement) we identified three different directions for prototypes:
Colors, shapes and icons. It’s all about visual perception: bright colors, big buttons and small tolerance for text.
Interaction flow. Involving a user to a journey through interface and guiding him/her through screens with a sense of flow.
Character. Tapping into user needs and giving a sense of freedom (to delegate tasks to character) and a sense of control (to make decision him/herself) while pleasantly engaging with the character.
The traditional, formal and slick looking as a control.
After testing all prototypes, we found that the respondents found character prototype the most engaging, fun to interact with and invoked positive emotions. The flow prototype was second favorite because of its clear interface, but the fast changing of screens made some users distracted. Based on results, we decided to explore character based interfaces furthermore.
Phase 3: Tony
And then we arrived to phase three; the creation of Tony the Thermostat. We did research considering characters in general and what different kinds of mediums (audial, visual, etc) we could use for the character itself. Additionally we performed research regarding interaction design and we tried to explore many different options. Here are some examples of Brad, Siri and Quartz:
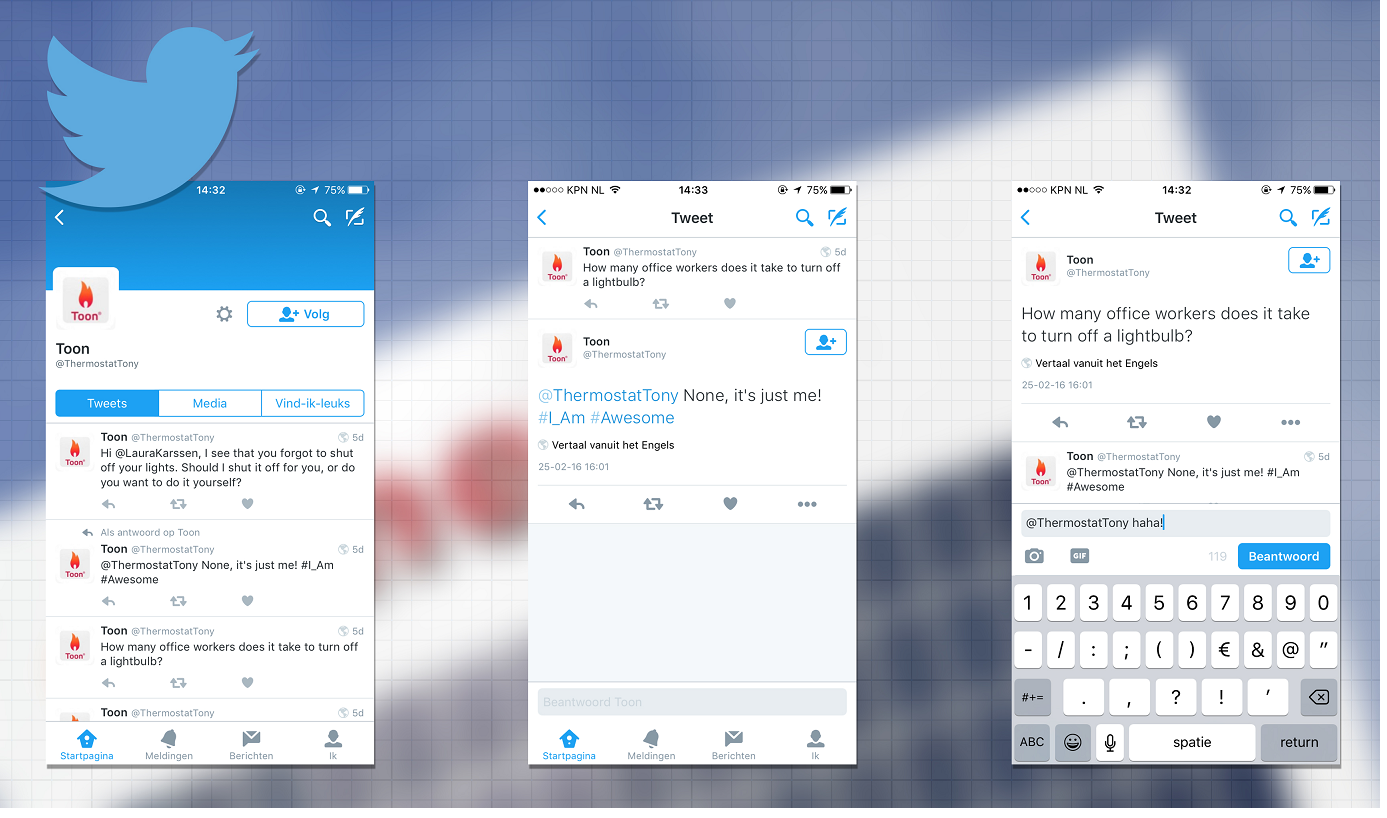
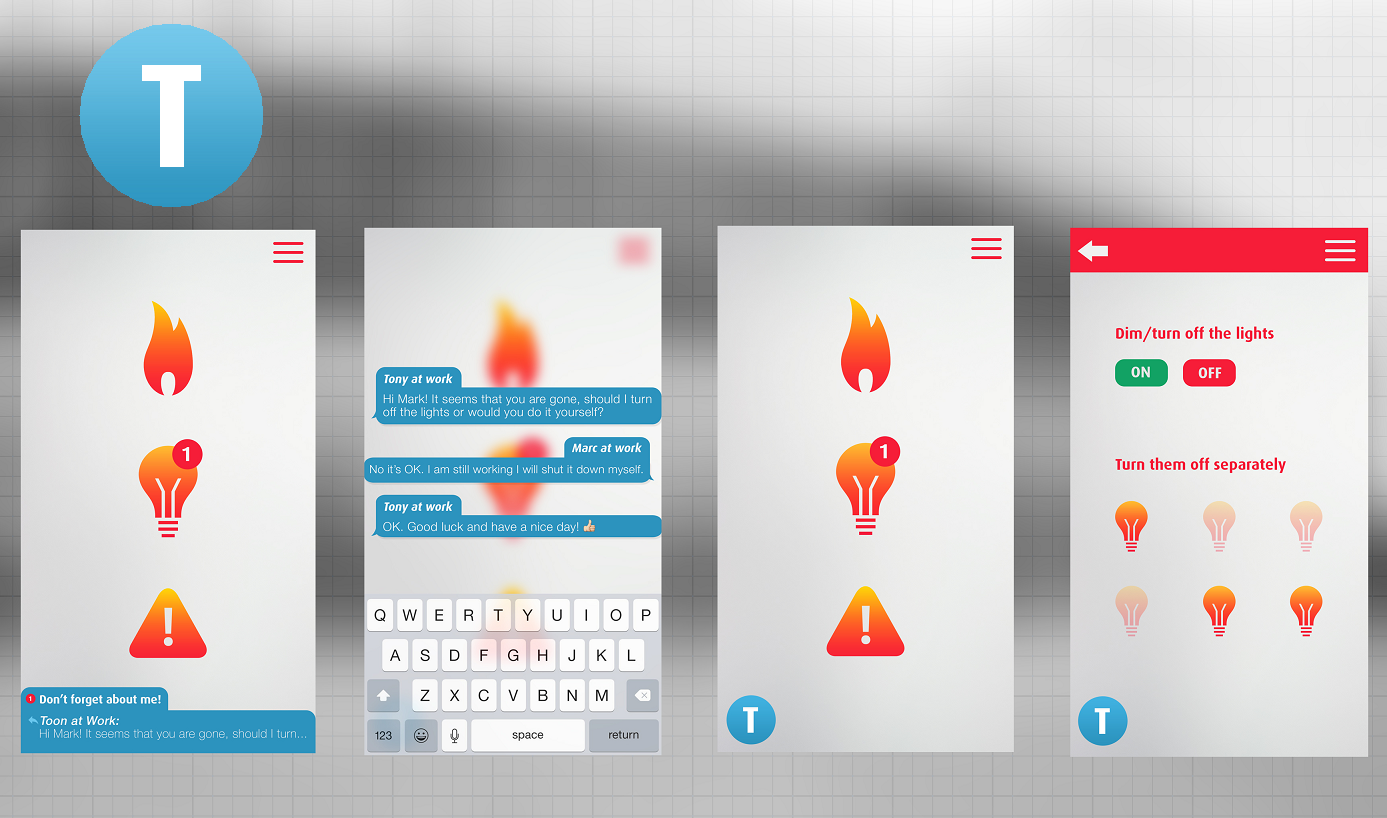
After all this we created the second (or fifth!) prototype: an app with Tony, the character, whom you could chat with as a guide and adviser in energy usage. Furthermore, we played around with the personality of Tony by creating a Twitter account.
We would like to test if Tony makes business people engage more with the service, but before we do that we want to be prepared. So we did a pilot-test with some of the workers at Eneco to try out how exactly to test engagement. To be continued!
Further Directions
As a result we’ve generated a lot of brainstorm material, such as seeing Tony as a real colleague. For a lot of flex workers reality is that they work alone most of the time. So, to have a friendly colleague would probably be enjoyable. Really seeing Tony as a partner could mean that you could give Tony a tour around the office when it is his first day. By doing this, for example, Tony could create a virtual map of the office and use this for his job. When seeing Tony as a partner it could also mean that Tony could ‘grab lunch’ with you to go over some statistics and insights in relation to your energy usage.
Another interesting thing to explore some more is the medium of Tony. What if Tony is on the coffee machine, or on the doors? When you look at a regular thermostat it is most probably white and almost invisible. What if we make it like a functional art object? In that way, Tony could be in the center of attention, but still be invisible.
But now…
the most important thing is to focus on getting to know the real users. Their needs, their frustrations, their wants, et cetera. This means doing a lot of networking and doing interviews. Maybe we’ll find out what the subtle balance is between the freedom and control our target group wants very badly.
Great projects start with a great team. Let us introduce ourselves.
Laura: “I am a third-year Media and Culture student. I am very interested in internet governance and the politics behind the biggest stakeholders in the new media world and I consider myself a movie geek.”
Antonia: “I am a graduating Game Design student with a design thinking minor background and also a volunteer at a scouting group and would love to work for children in the future as well.”
Thierry: “I am in my last year of Communication and Multimedia Design in Rotterdam. I am inspired by music, art and culture. In my spare time I like to create graphic designs and film & video.”
Rokas: “I am a student in Advertising with international experience, driven by nature, people and the pursuit of perfect design. I seek paths not yet explored to find new insights and solutions. Occasionally I backpack and go on a crazy adventure.”
Together we are a multidisciplinary team with a wide set of skills and a clear goal to create value for our partner “Eneco” in this 5 months project.
During this semester you will be able to follow our journey through the eyes of the whole team and each individual separately. Let’s begin!
Getting to know “energy wasters”
“The broader one’s understanding of the human experience, the better design we will have” – S. Jobs.
Finding underlying users’ wants, needs, aspirations together with struggles they encounter every day, sets the direction of design process. Therefore we created a user video to get to know our users better.
We distinguished our main stakeholders as small and medium companies, who are not aware of energy waste due to inefficient heating, lighting and appliances use. Forgetting to turn off the thermostat, lights and other electrical devices contribute the most to the energy waste and therefore – energy bills.
This is the cost of forgetfulness, but what is the cause?
The cause of energy waste in companies
To switch everything off for the night might require finding dozens of switches, programming the thermostat, searching for any device that is still running and turning it off as well. It’s a lot of work, especially, when it is the last task you have to do before going home at the end of a long day. No surprise that people accidentally or intentionally forget to execute this task properly. After all, energy saving shouldn’t waste people’s time.