

Kicking of and creating our user scene
YES! Our first week as a team is a fact. It was love at first sight when we first met while kicking off last wednesday. To get to know each other, everyone was asked to prepare a Pecha Kucha, which we presented in the morning. This was a fun way to learn more about everyone’s personality. After these quick introductions we had lunch outside. This might sound weird in the middle of the winter, but since the sun was shining it was actually really nice – okay, and because the studio was fully loaded-. With new found energy we officially transformed into MediaLAB employees by signing our contracts and a Tour through the maze that is called HvA. Gijs showed where we could find what and gave us insider tips about where to get the best coffee. After the Tour, it was time to get to work.
In order to clarify which problem we exactly need to tackle for Submarine, we developed a ‘user scene’ to get an better understanding of the context of the project and our particular task in it. In doing so, we met our embedded researcher Stefania Bercu with whom we worked out our first ideas. Stefania has already been working on the project for half a year and filled us in on her work and progress. . Defining the problem turend out to be quit a brainteaser. Falling in to a already up and running research was pretty challenging at first, but after an intensive brainstorm session we defined the problem to the best of our ability. Which turned out to be the following:
When it comes to interactive documentary, Submarine is a leading organisation. Their web based documentaries are opening up a new range of possibilities. On the one hand it provides a richer experience for the viewer, and on the other hand it enables the producers to monitor user data. Google Analytics seemed the perfect toolkit for mapping this. Although Submarine can now see data like users locations, visiting duration and click rates. They can’t translate this endless sea of loose pieces of data into meaningful information; Google Analytics doesn’t present user data in a way that allows the producers to get an understanding of how users engage and interact with their creation.Which would accordantly enable them to enrich the user experience. To make meaning out of all these separate fragments of data, embedded researcher Stefania conceptualized a way to transform these standalone dots into potentially meaningful packages of information. Namely by correlating them. Although this already is a big step, in order for this data to become actionable for Submarine, another sea has to be crossed: making these packages readable.

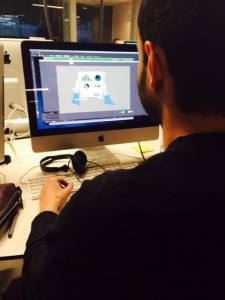
Yannick and Geert worked there asses off while animating the user scene. The result – if we may say so ourselves -is quite amazing: