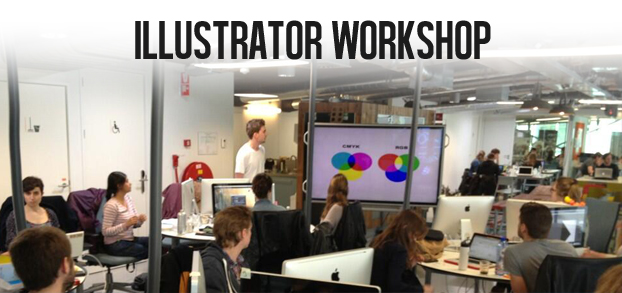
Yesterday Jelmar took a workshop on the basics of Illustrator and how to make an infographic. Niall, Linda and Sabrina helped in assisting the teams develop their infographics. We explained that vector images work with CMYK color combinations. These are the same colors that are in your printer, so if you are designing for print media you might consider working with Illustrator or InDesign which are all vector based images.
Vector and Bitmap
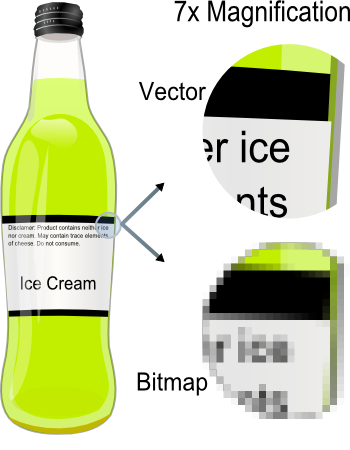
A vector based image is an image which is not build out of pixels but out of vectors. The difference between these two are explained in this image:
As you can see the vector image stays sharp. This also means we can scale the image (if its vector based) as much as you want.
3/30/300
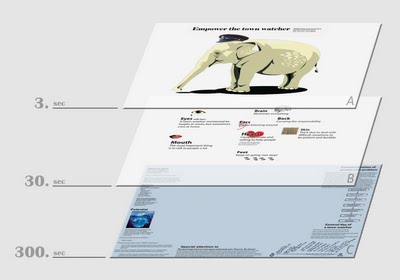
A rule you can take in account when your creating an infographic is the 3/30/300 rule. This means that within 3 seconds the main subject of your infographic is clear. In 30 seconds the main subjects or themes become clear for the reader. And in 300 seconds the reader must be able to read through the whole graphic.
Start on paper
It’s very important to start sketching on paper before working on your computer. First draw your whole idea or concept as this will save a lot of time. You can also receive feedback from others. If you are not good at drawing, doodling also works. Make it a rule for yourself, to make a random drawing each day to enhance your drawing skills.


