Sprint 5 // Elaborating the final concept
The challenge for the fifth sprint of the process was to start elaborating the final concept of a cross-platform service, a new way of interaction for live streaming enabling personalization and group belonging, integrating the conclusions and ideas of the last sprints and deliver a business model and data model.
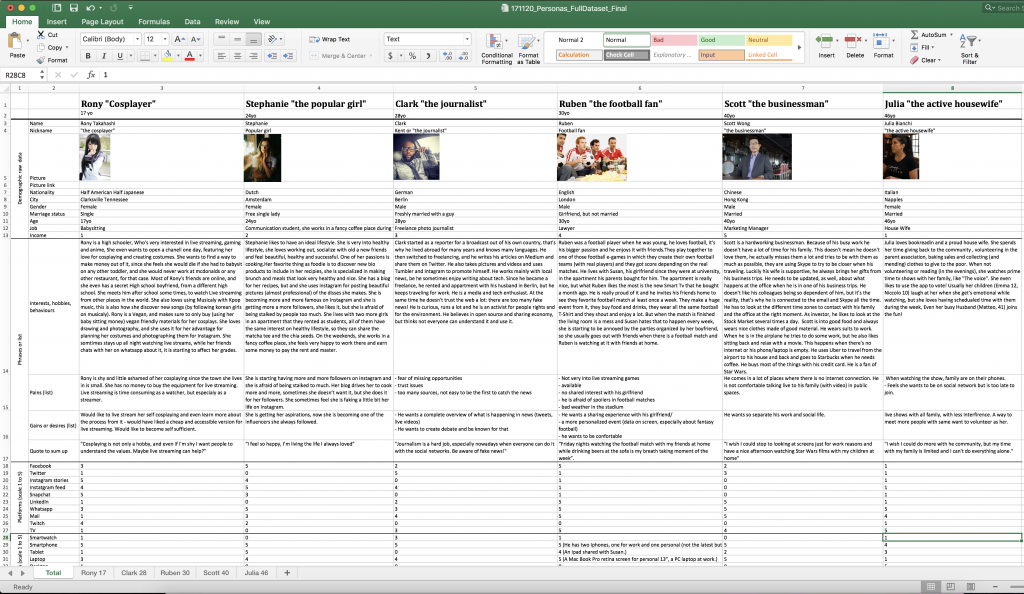
// Our users
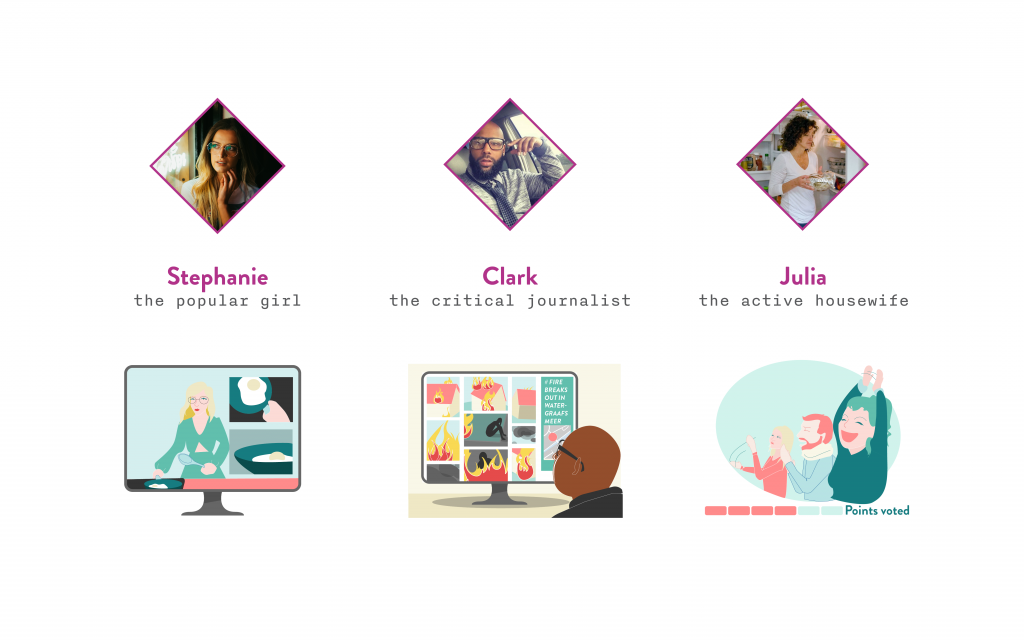
As explained on the last post, after researching and observing different users’ profiles and behaviors, we created three different personas and designed three different solutions for each one of them.
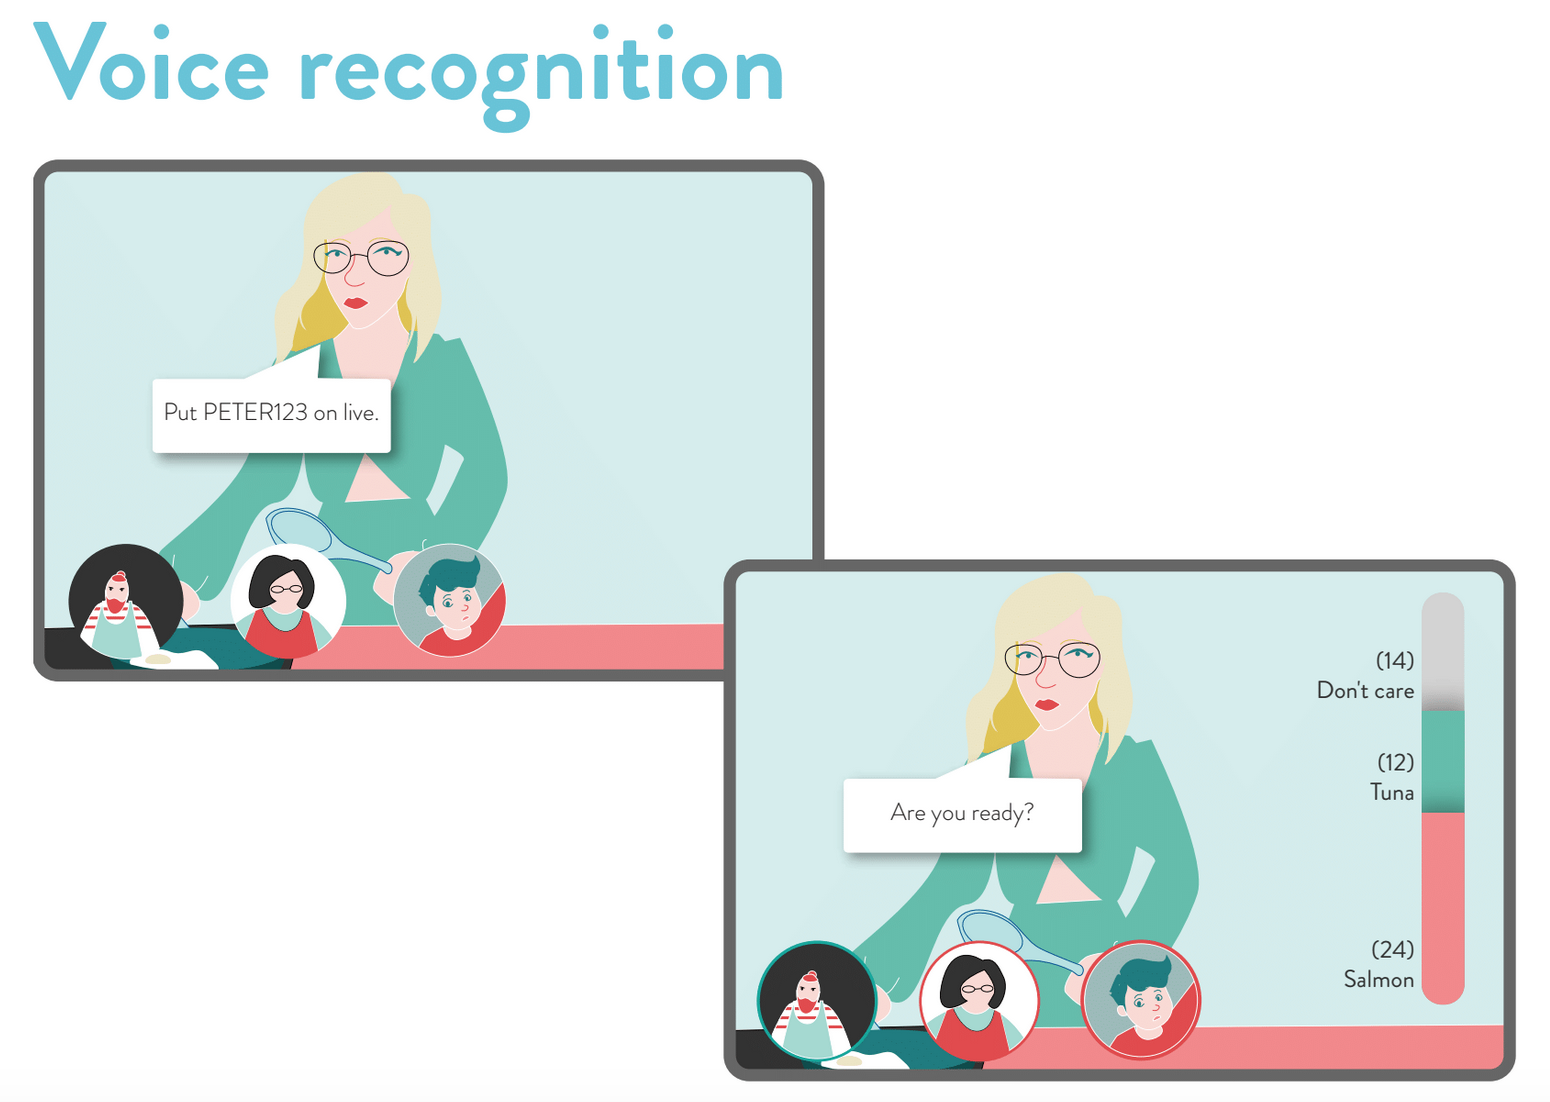
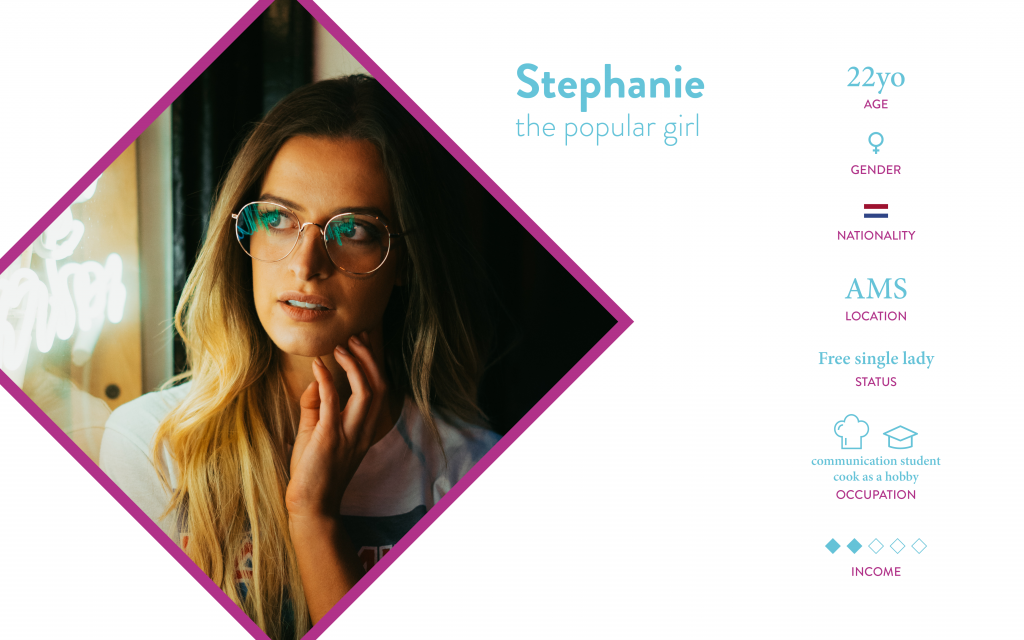
As wrote in the last post, regarding Stephanie’s profile (foodie live streamer) and her pains and gains, we designed an easy way for the streamer to interact with her followers enabling group belonging in the audience. Making for her easier to get feedback from the watchers to improve her live streams and performance and the watcher can interact with the streamer through clicks, voice recognition, which makes the streamer work more efficiently. The solution enabled the streamer also to have smaller groups of watchers depending on the active role and engagement with the content.
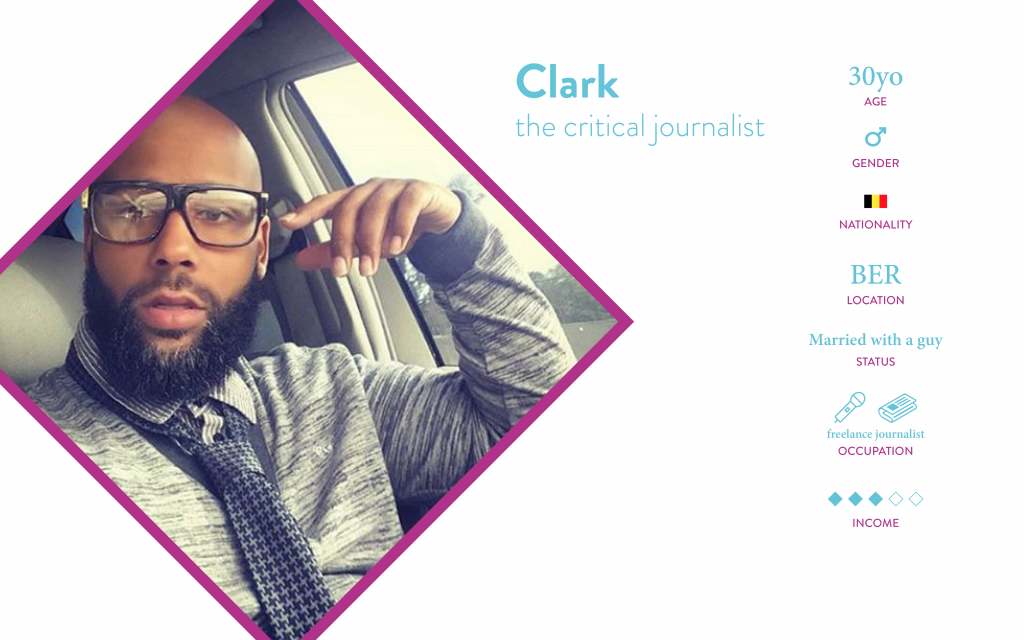
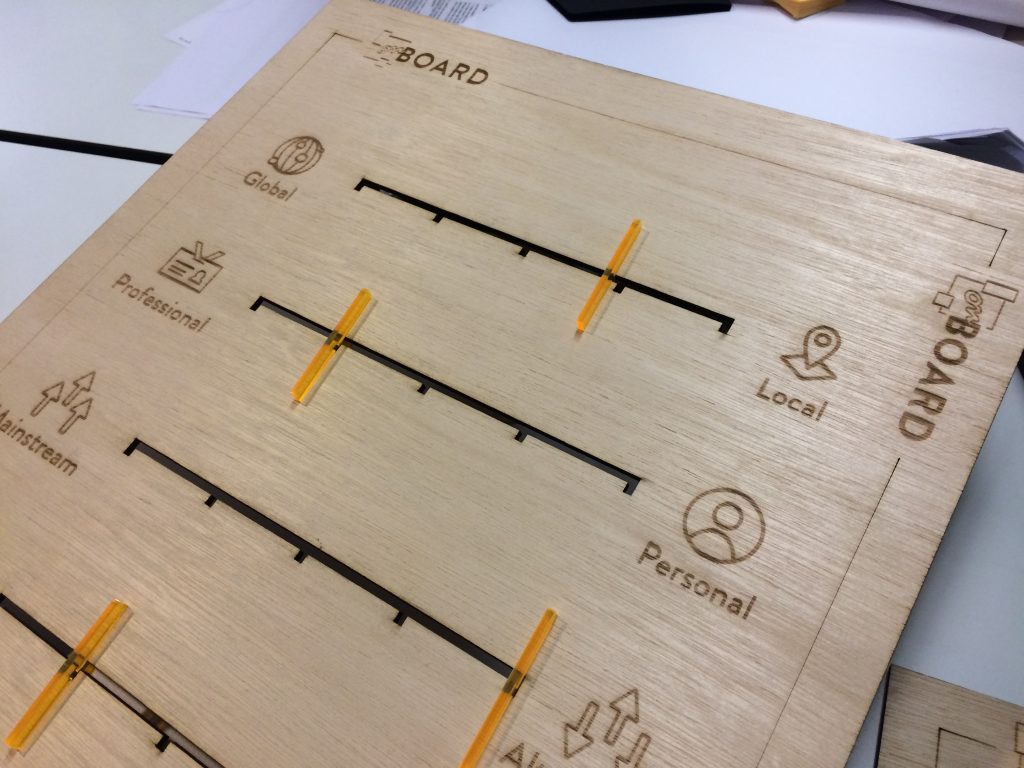
In the case of Clark, we created a transparent and collaborative system for consuming and broadcasting news. In this concept, anonymous individuals can live stream their own content about news from their point of view. From the other side, Clark, as a journalist, creates his own online magazine (board) with the live streaming content of the anonymous people, with the help of a filtering algorithm.
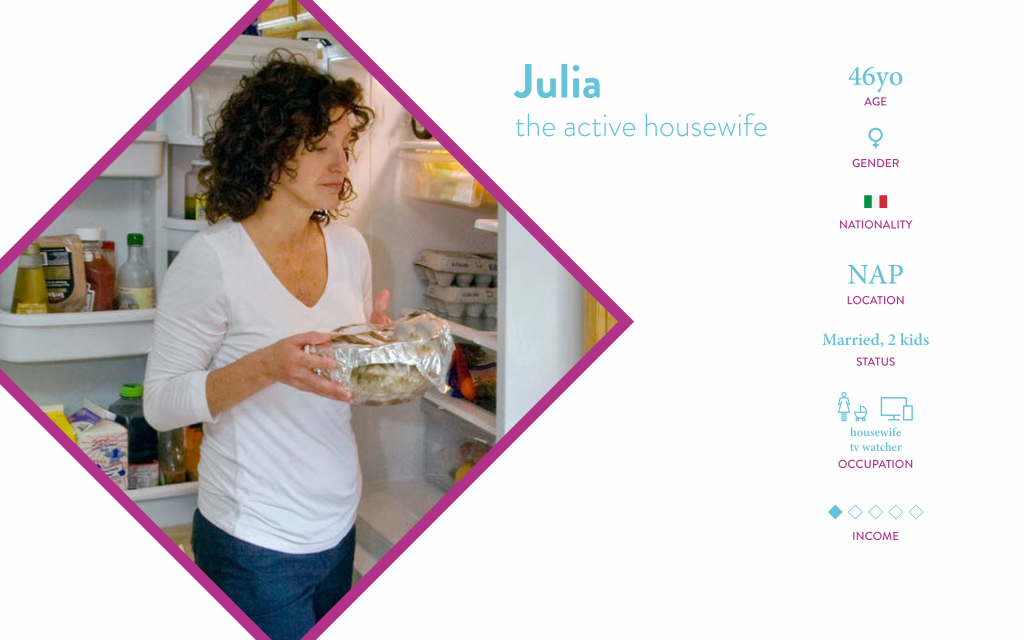
And as a solution for Julia we developed a new way of interacting with an entertaining video content for the family in one screen/device enabling the participants to interact with the content (TV Show) through voice or face recognition and strengthening family bonding thanks to a shared profile.
Once presented the three different fields, users and solutions to our partner, we decided to focus on the first idea, the live streaming platform and interactions for streamer and watchers in a cooking context. Even though the first idea was chosen, we tried to get the most interesting features of the other two ideas and implement on the main one.

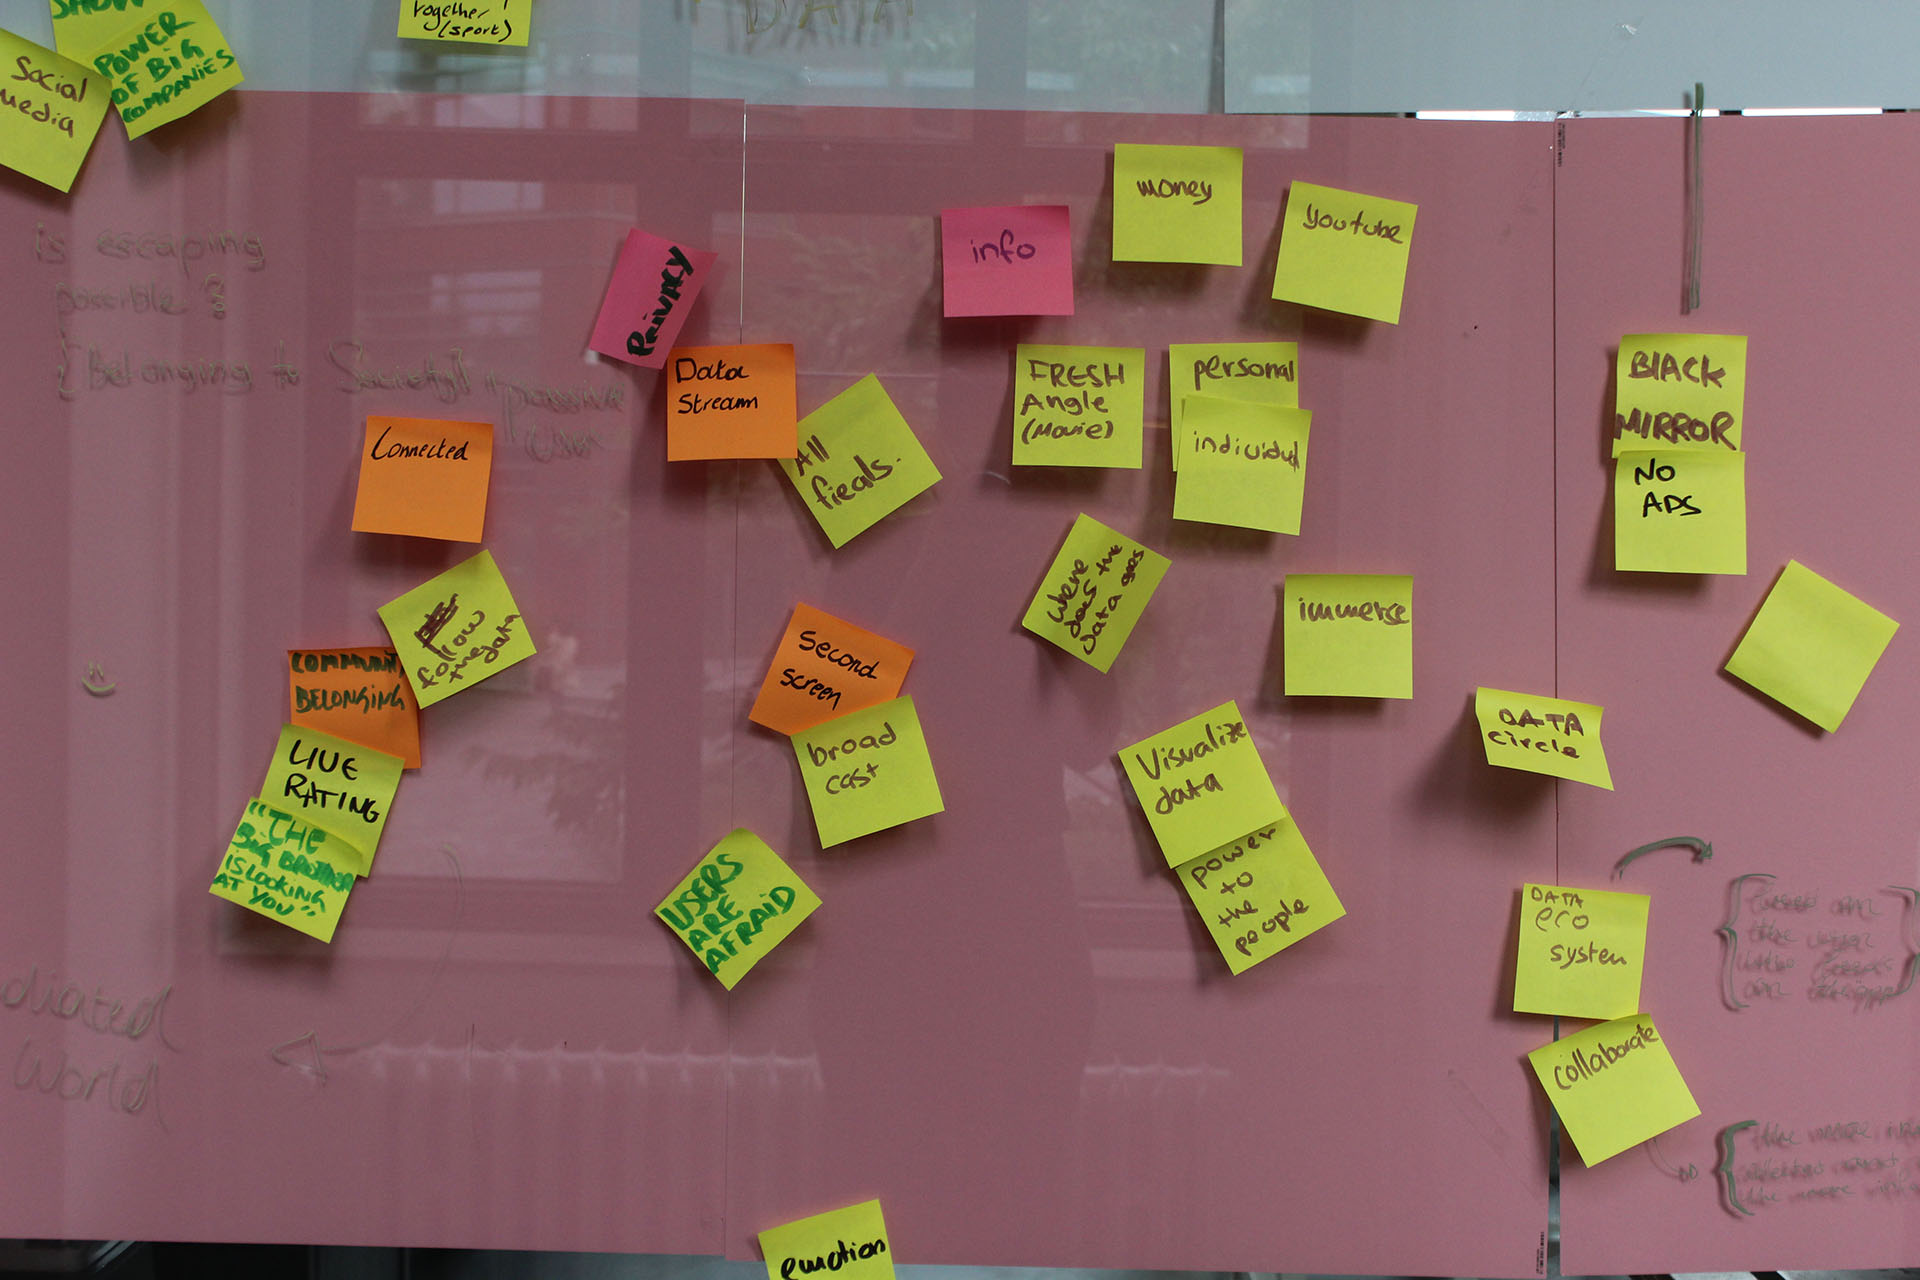
// Research
The research phase of the fifth sprint was based on analyzing live streaming platforms as well as observing different tools that could be used on the last concept proposed.
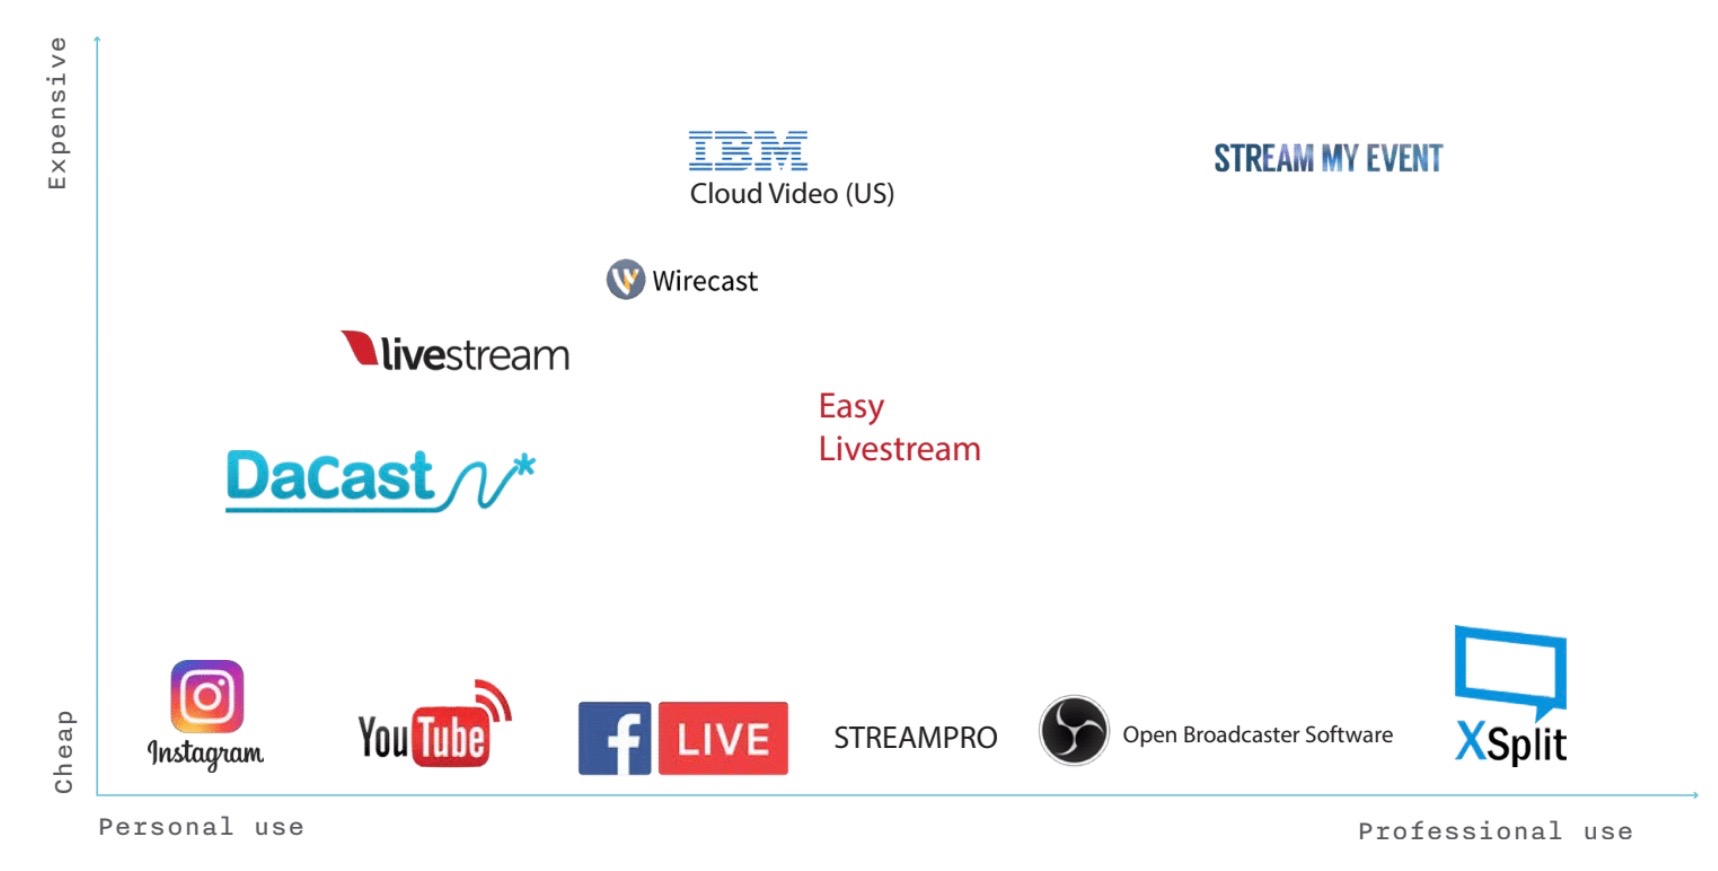
On the following graphic we visualized the different live stream platforms analyzed regarding affordability and use:
// Final concept
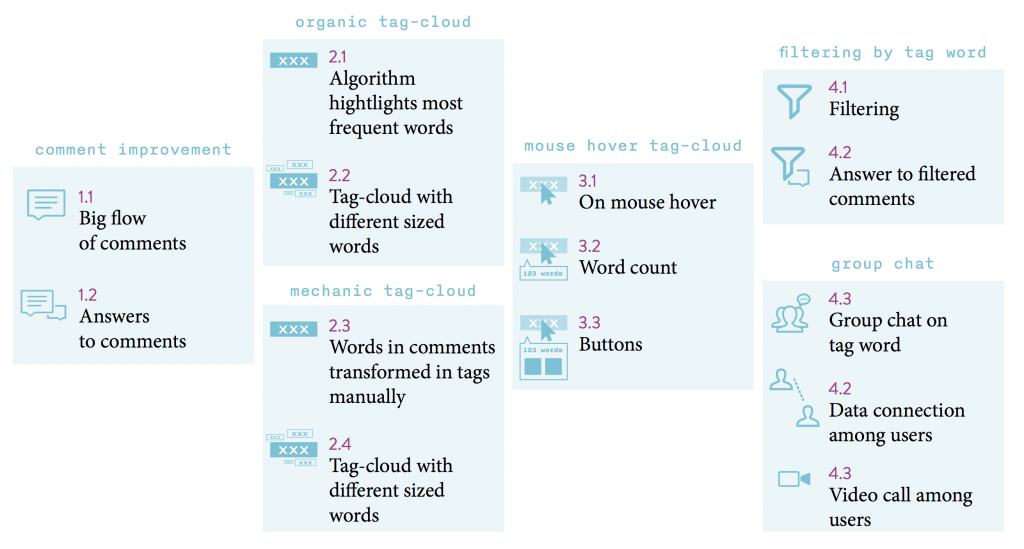
As a final concept we ideated a platform to enable an easier and more effective live streaming experience for live streamers and more interesting interactions for watchers.
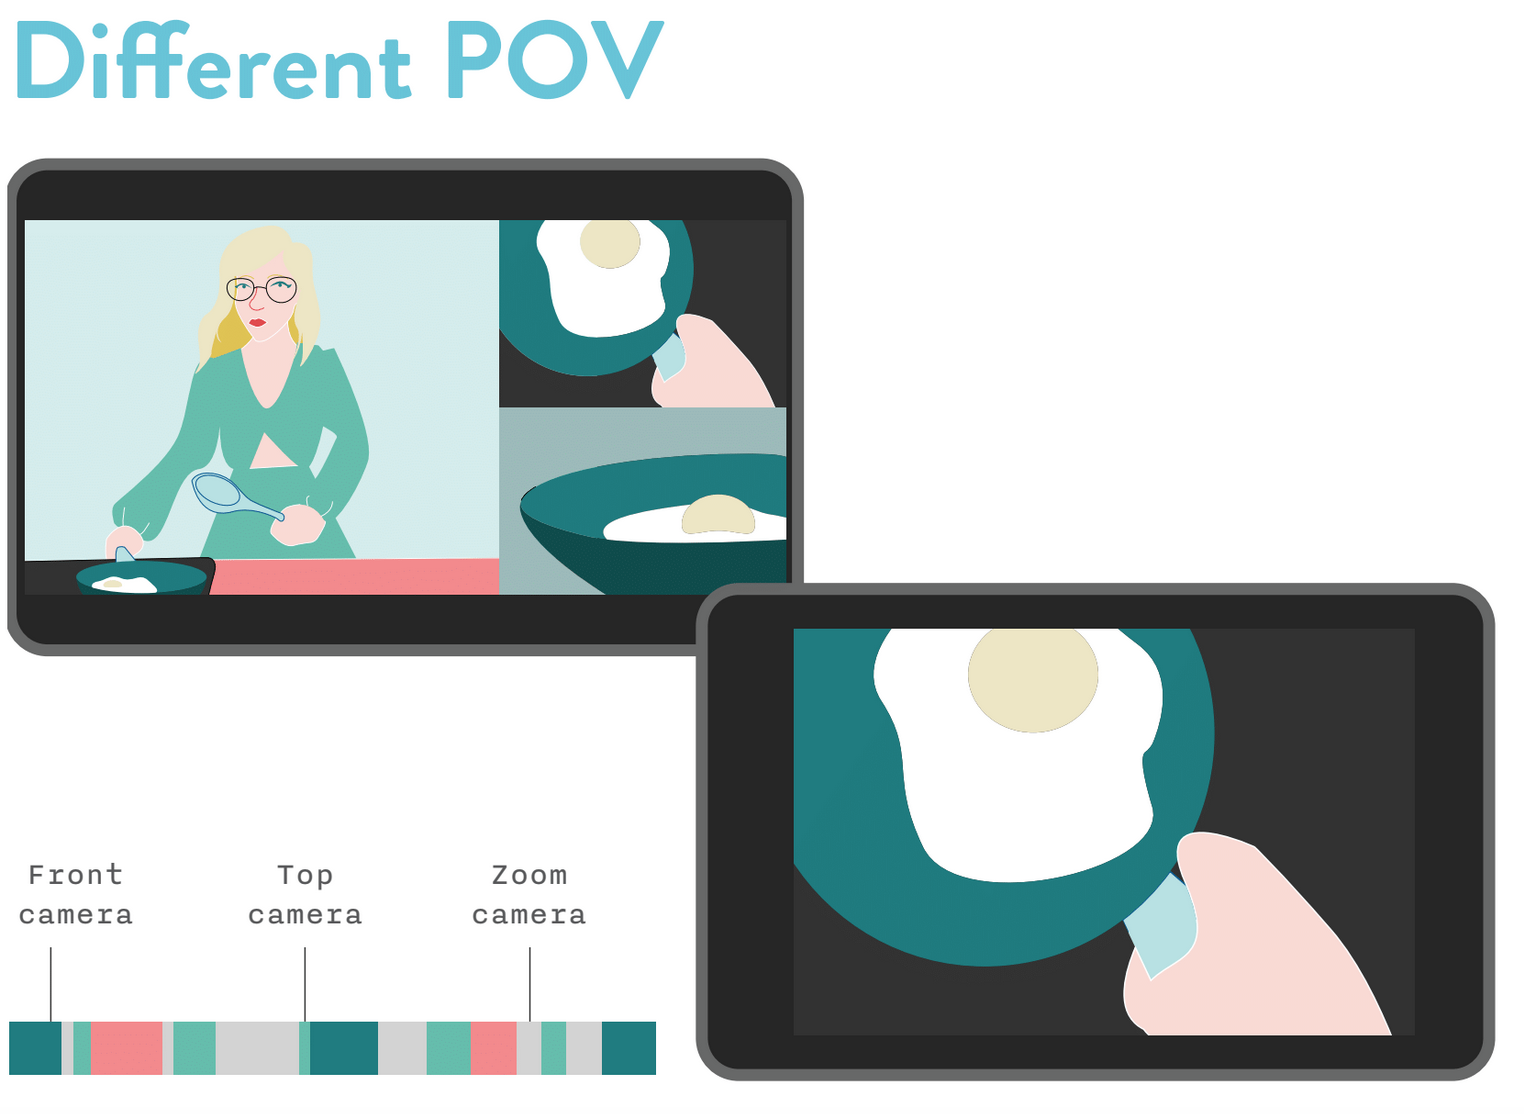
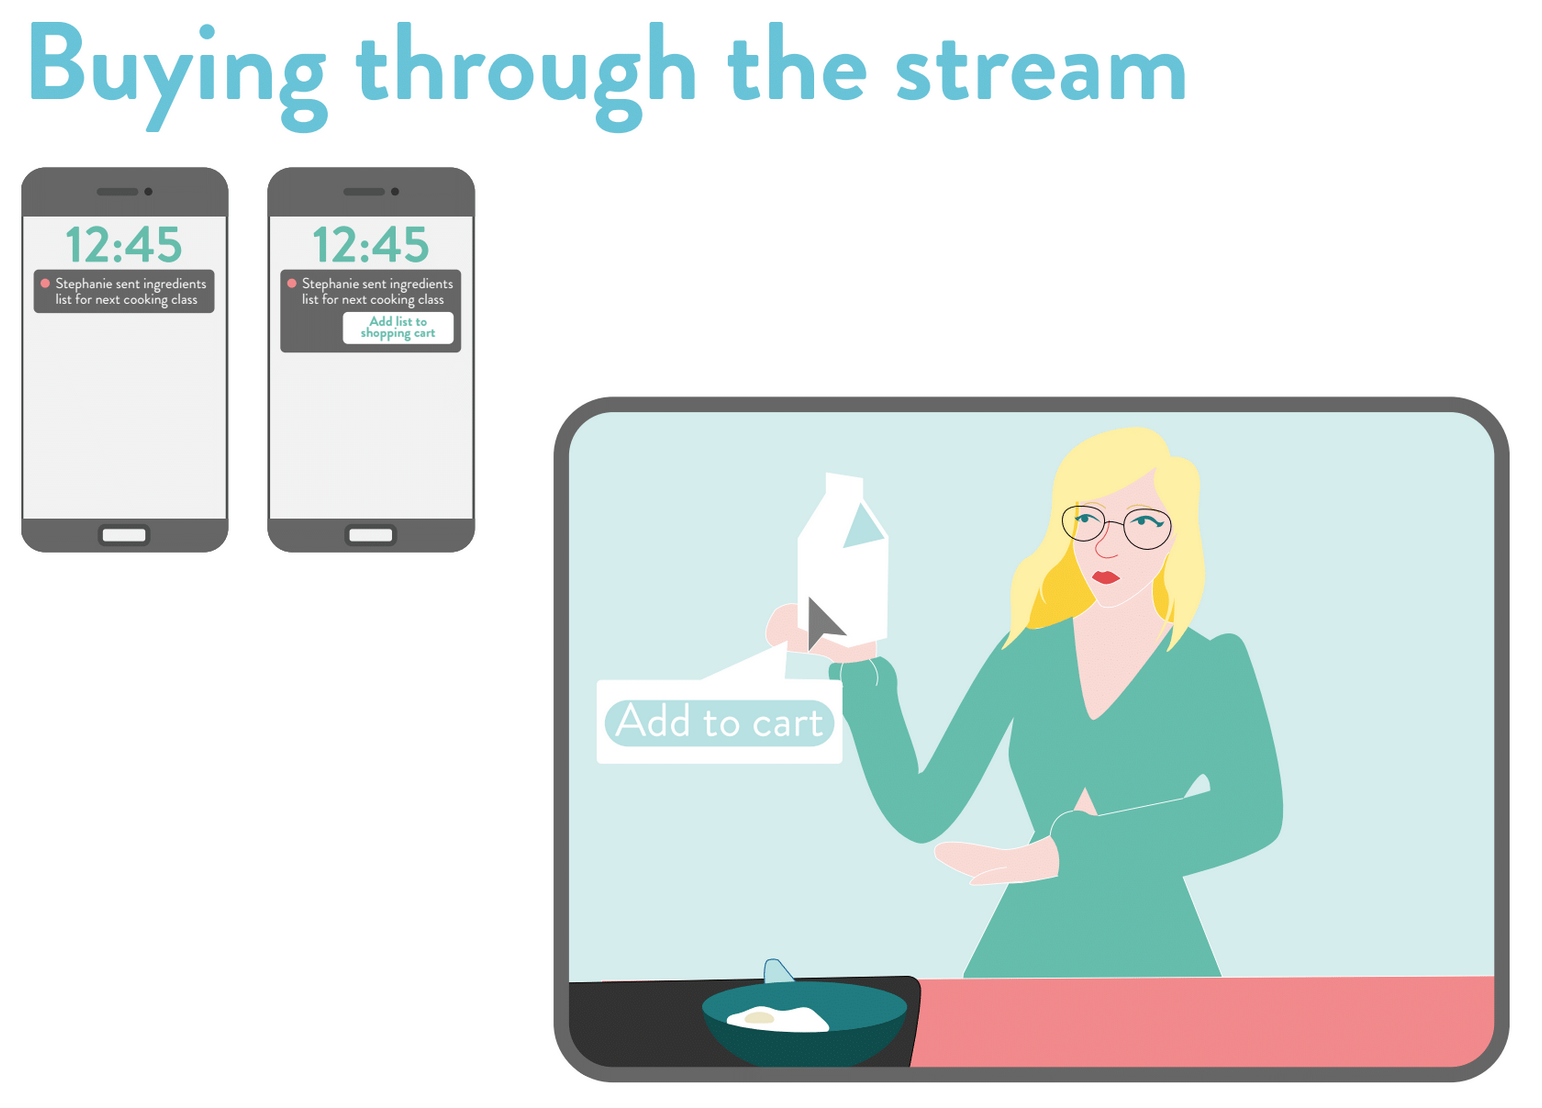
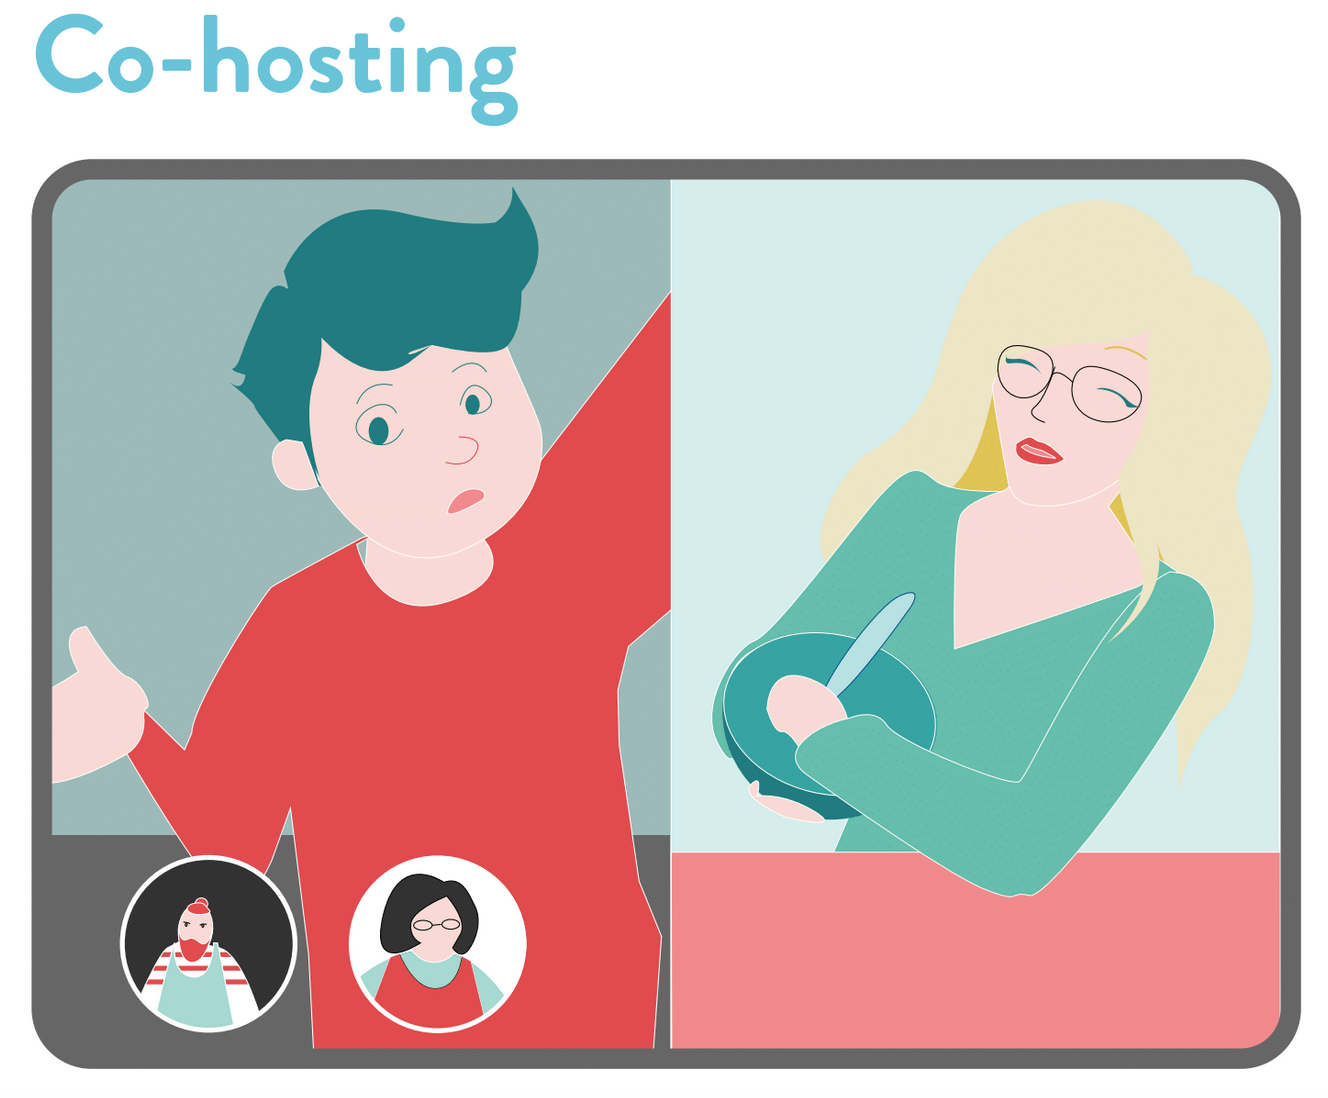
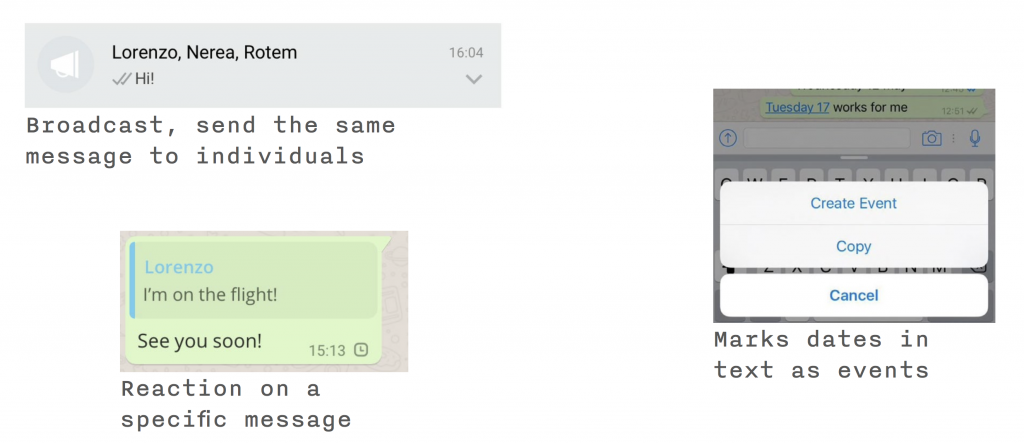
From one side, the platform had some primary features as the possibility of changing the point of view of the live streaming video; buying objects from the live stream video by clinking on the screen through object recognition; hosting watchers in the live streaming giving them the opportunity to co-stream together with the live streamer; voice recognition in order to enable conversations and asking questions during the live stream.
From the other side, the platform offers some secondary features such as the possibility of having highlights and quick recap when the video is not live any more and the possibility of offering a different context depending on the context of the watchers while watching the live stream.
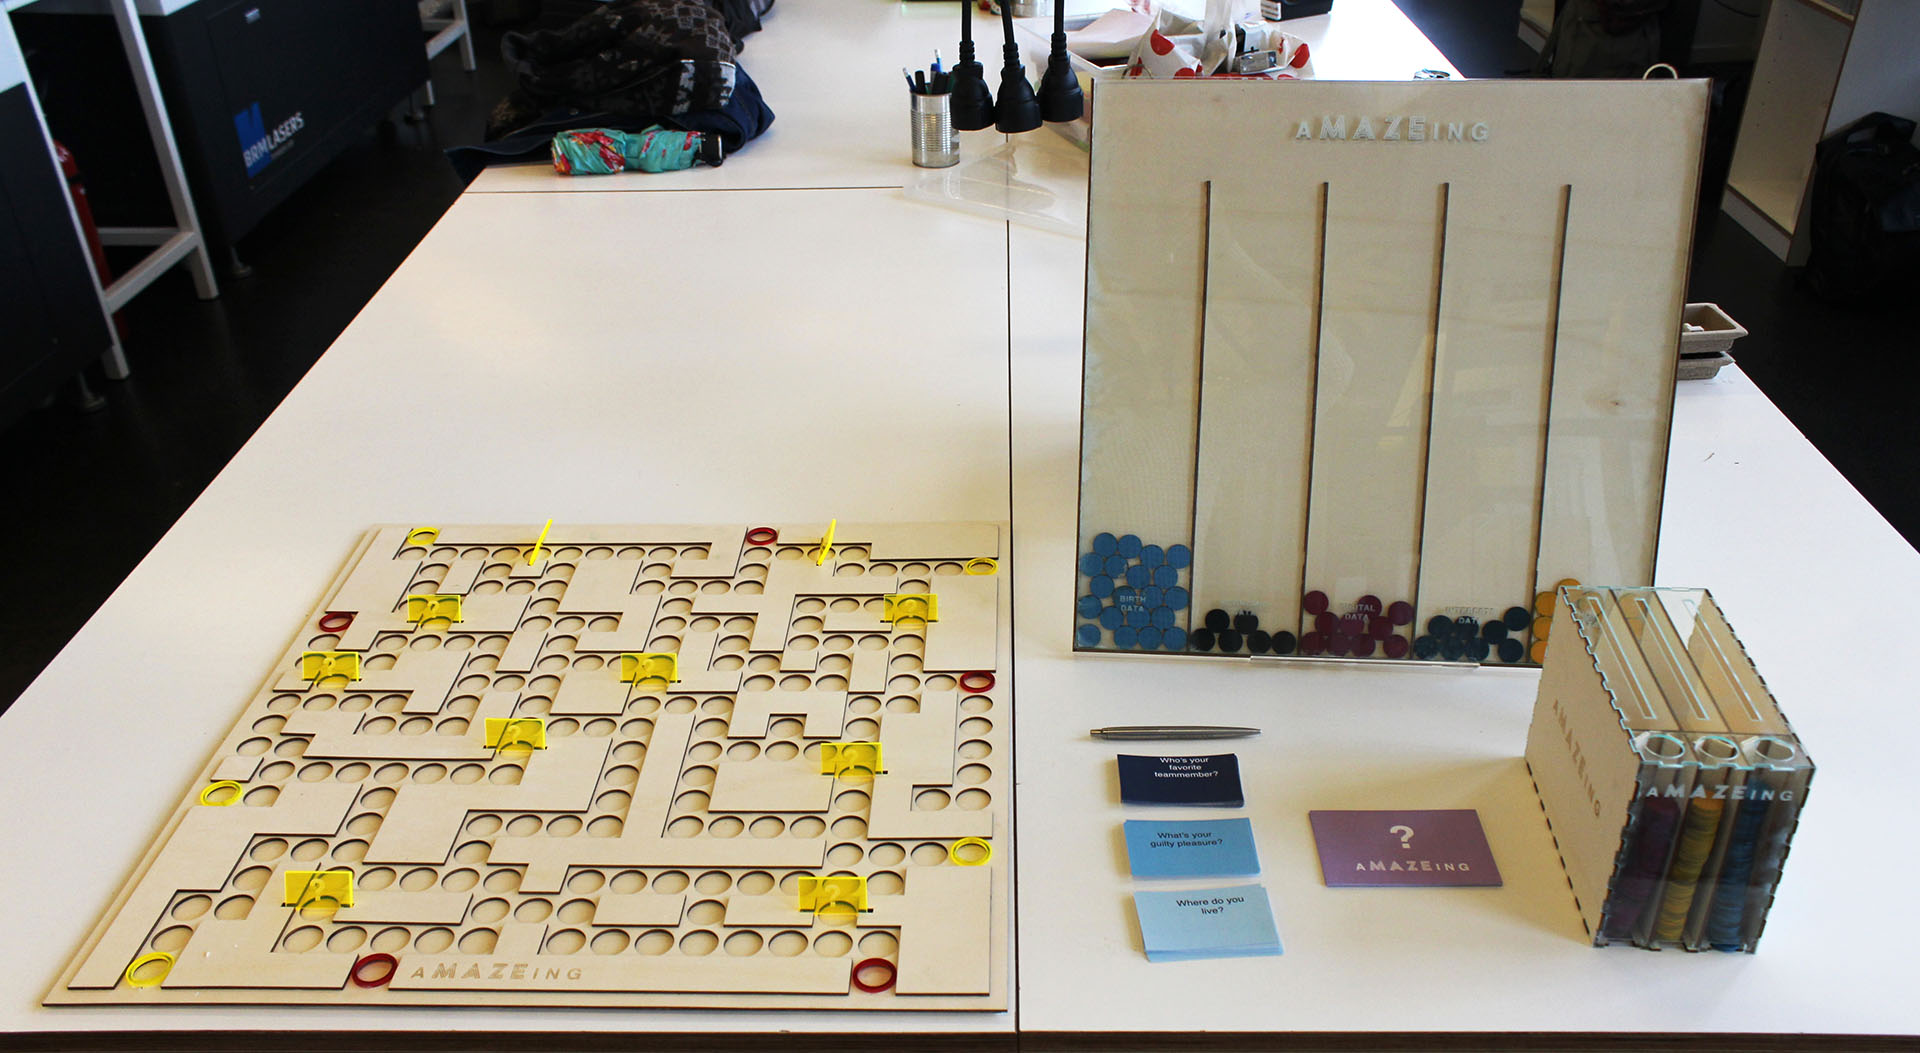
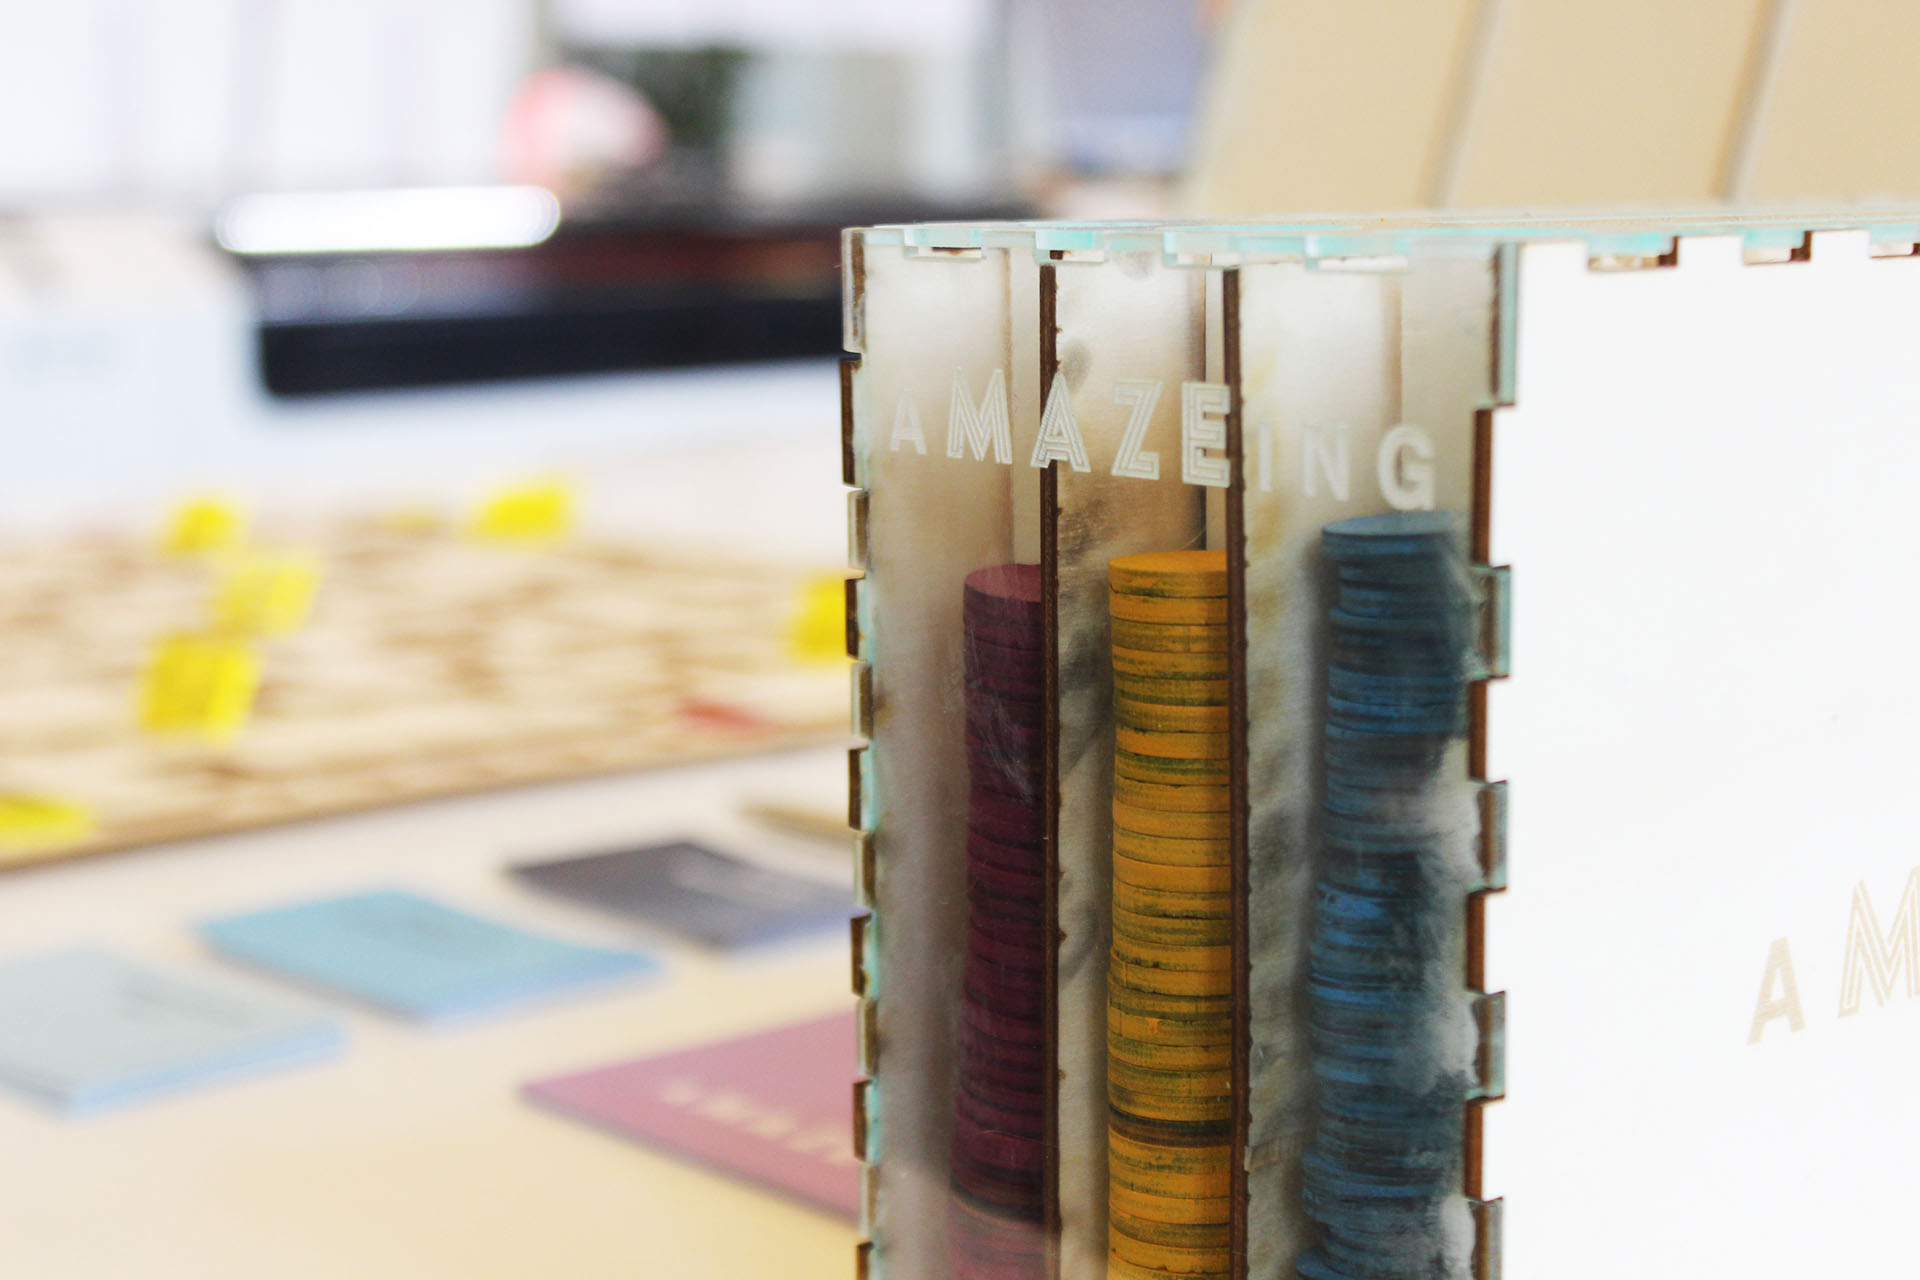
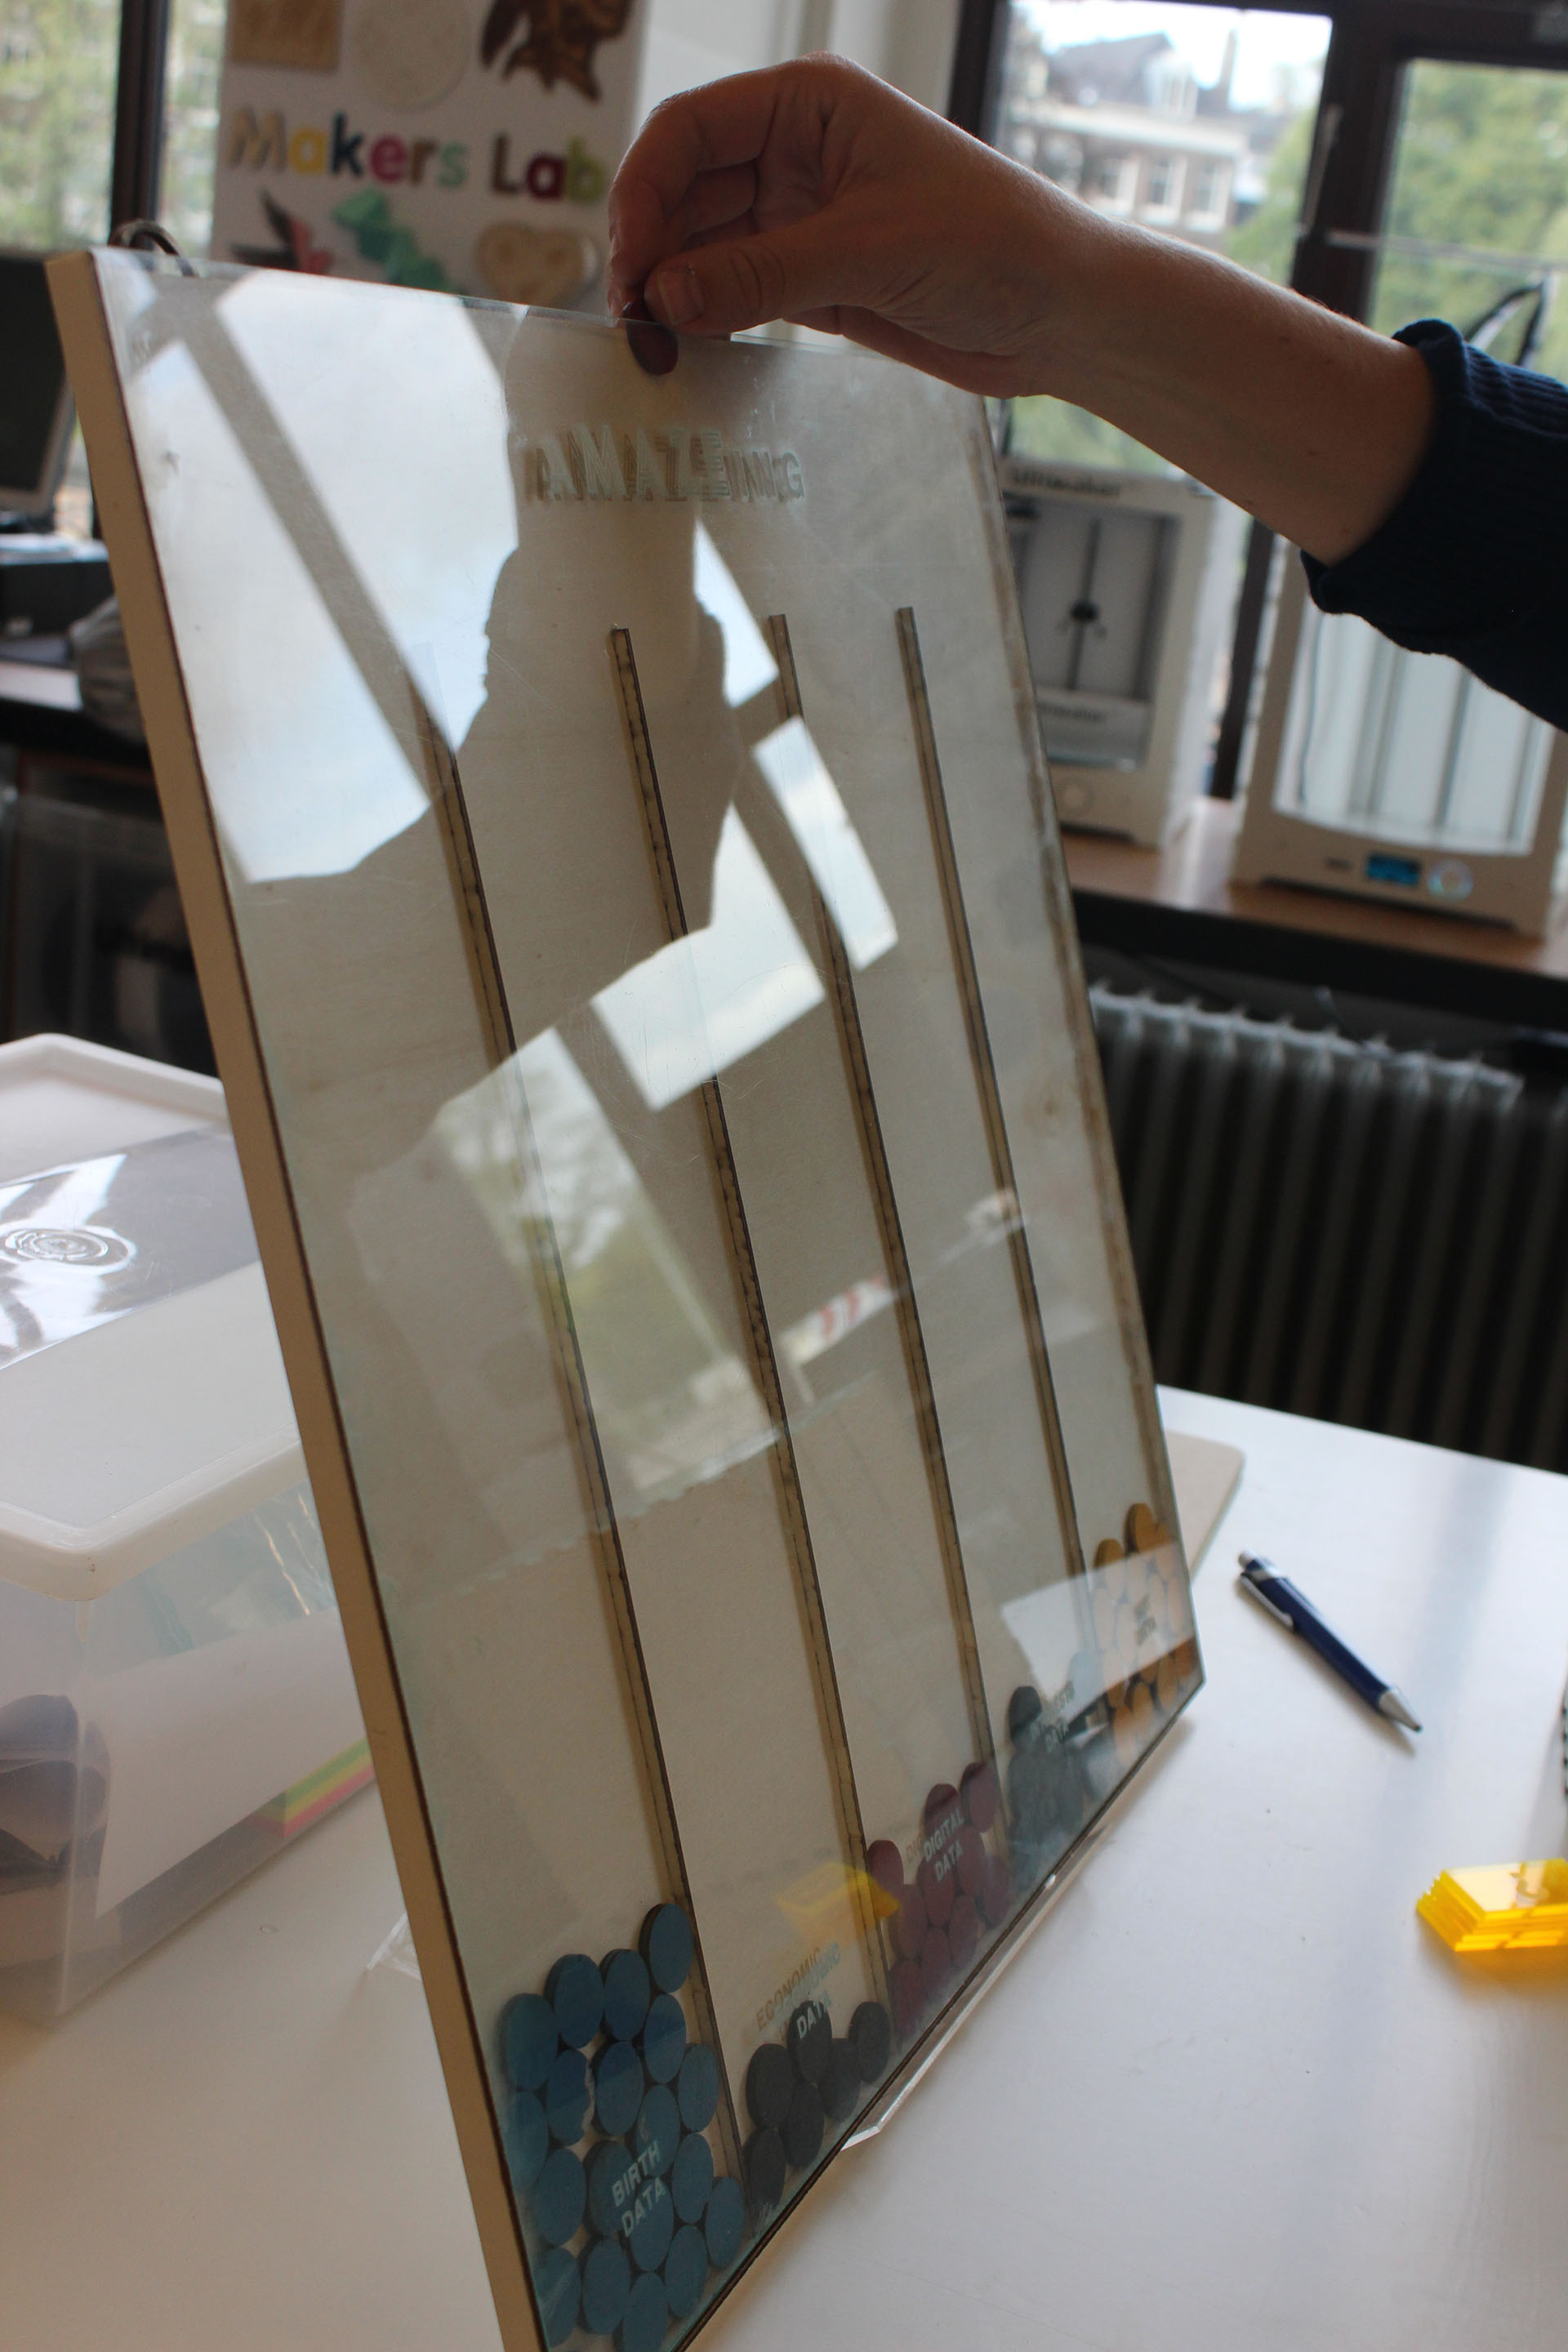
Together with the final concept we started to work in the data model behind the idea, in order to understand the kind of data that can be collected, the sources of data, and the key activities in order to get different outcomes and trends as a result.
In this data model, we started thinking on potential partnership that could be created with retail companies due to the interest they have on knowing what happens once their customers are consuming or cooking their products at home.
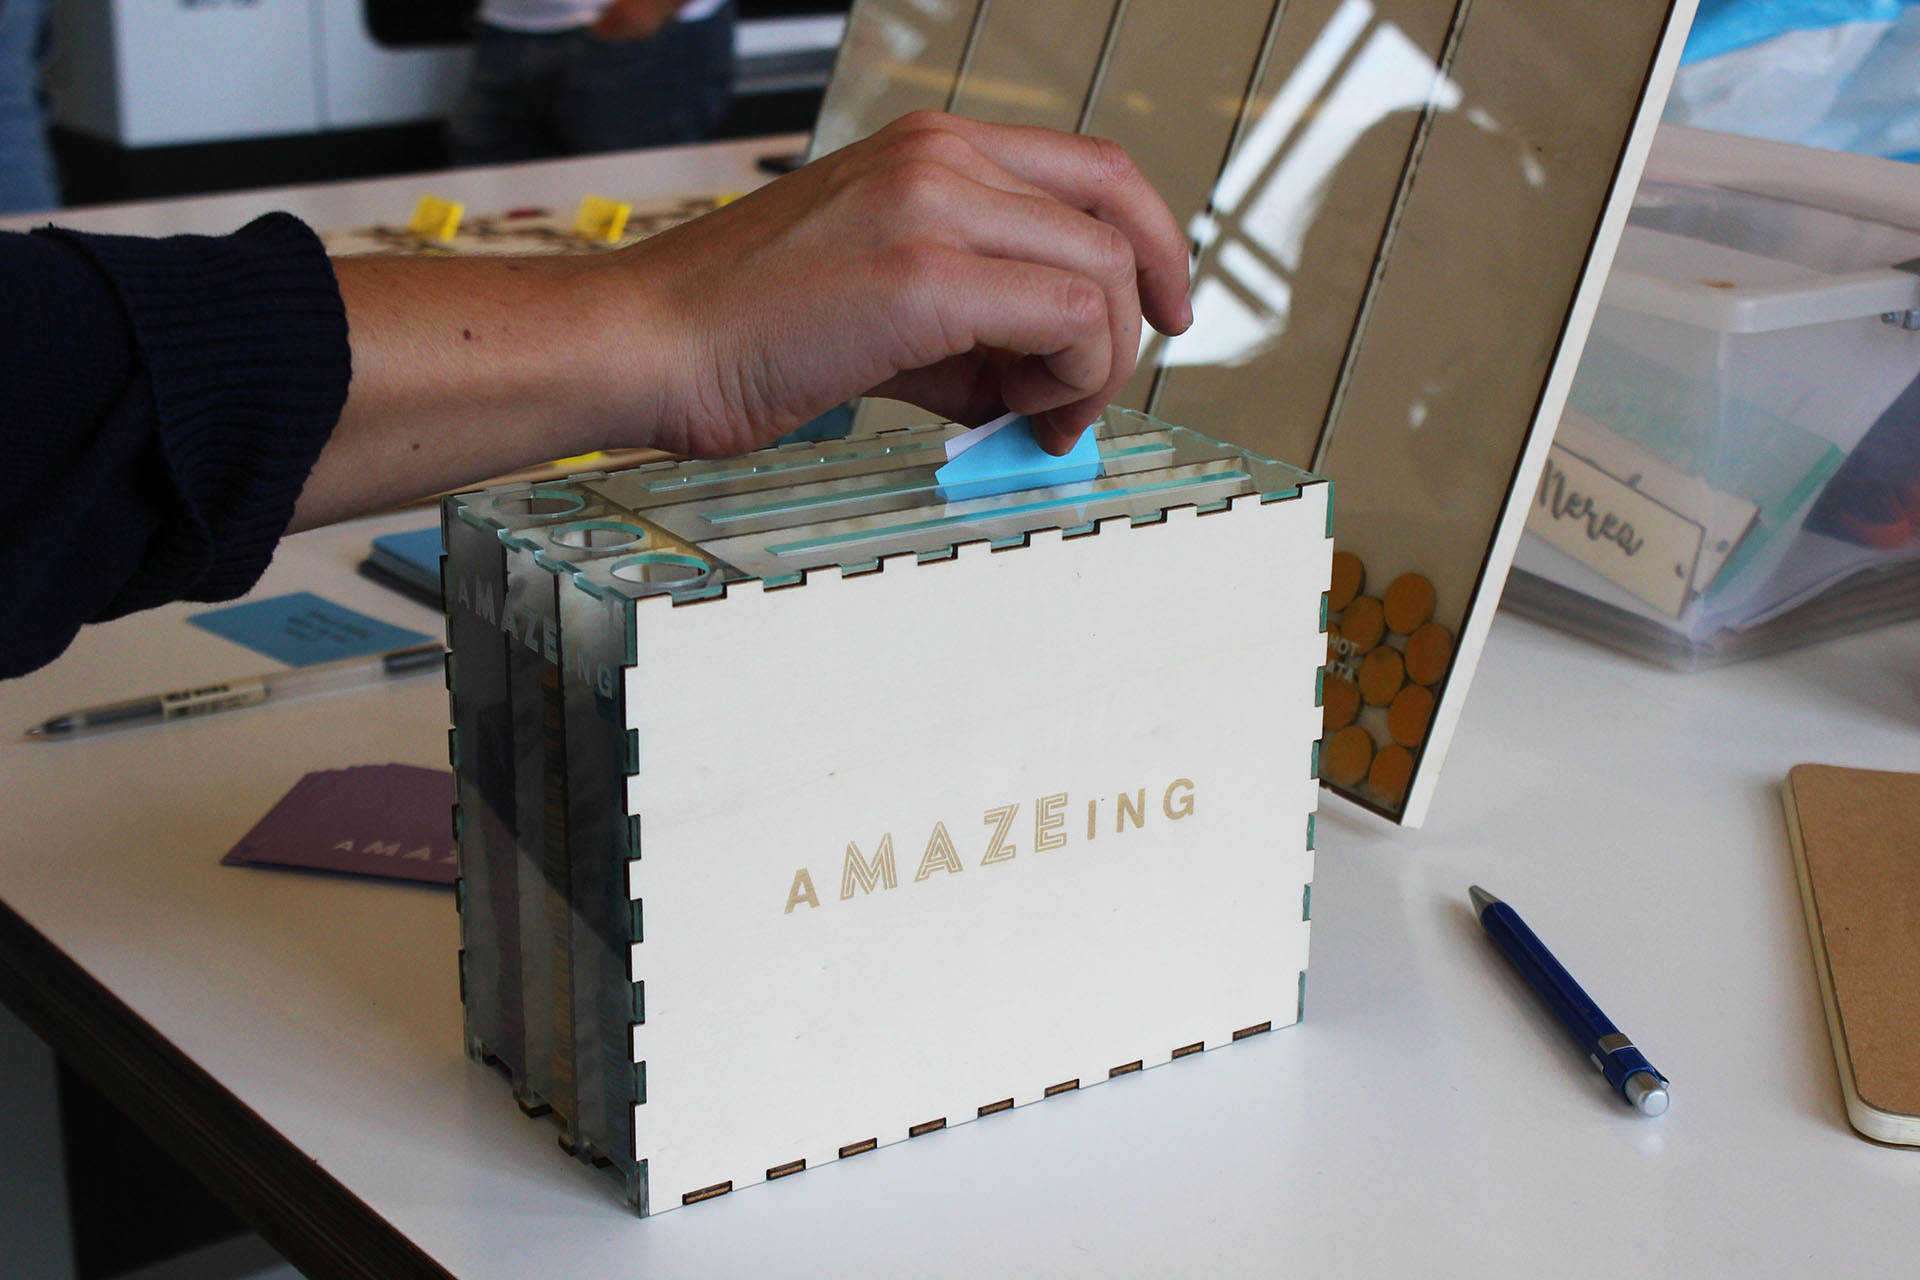
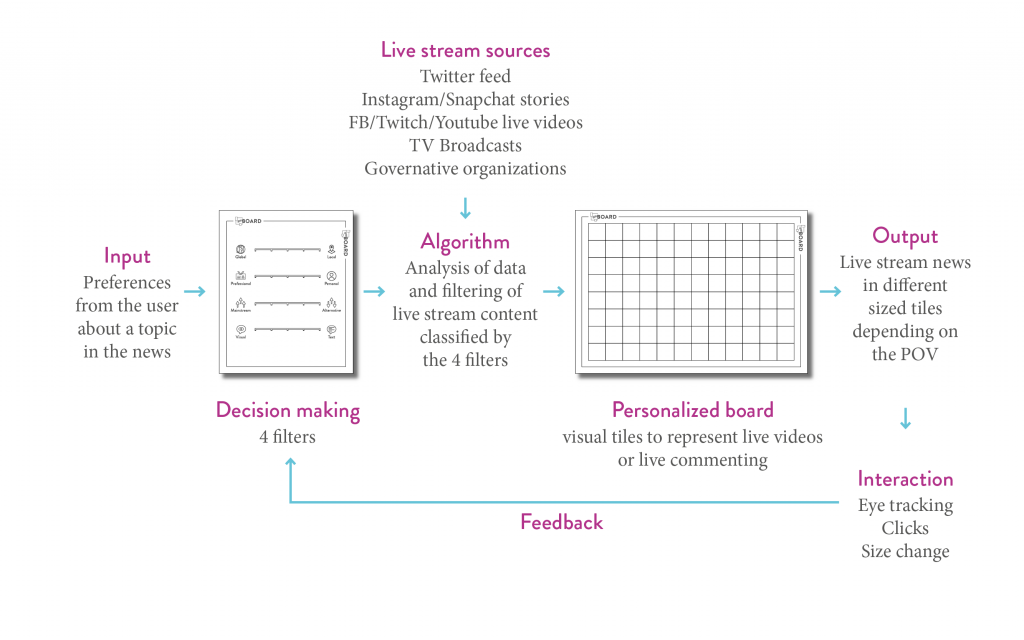 The platform is composed by a decision making system and a personalized board, it’s designed as an app for tablet for the filtering system, as a computer platform for personal use of the board, as interactive mirror layer for a family or group context and as a wall screen for a working environment.
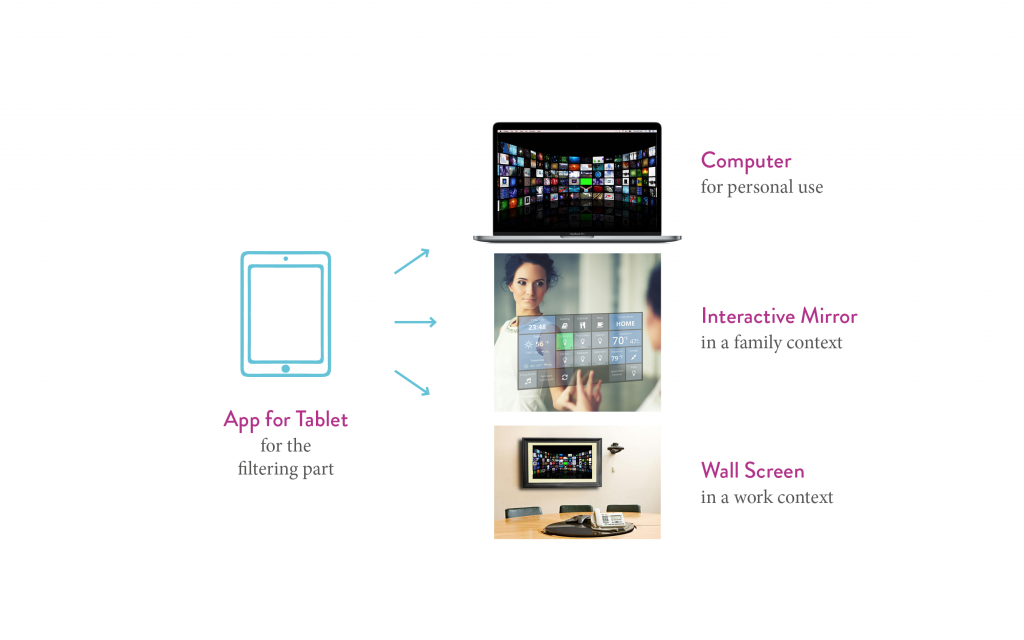
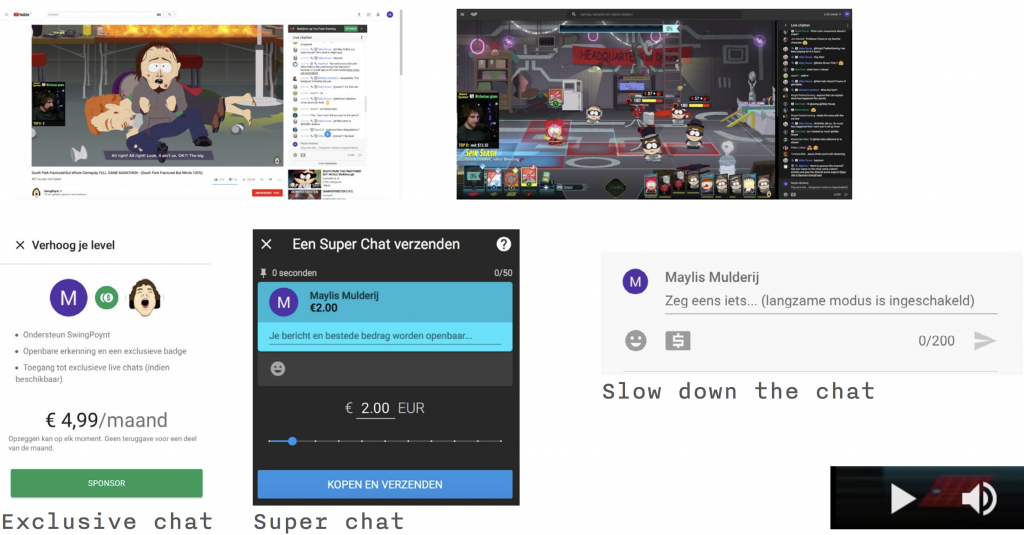 YouTube Features
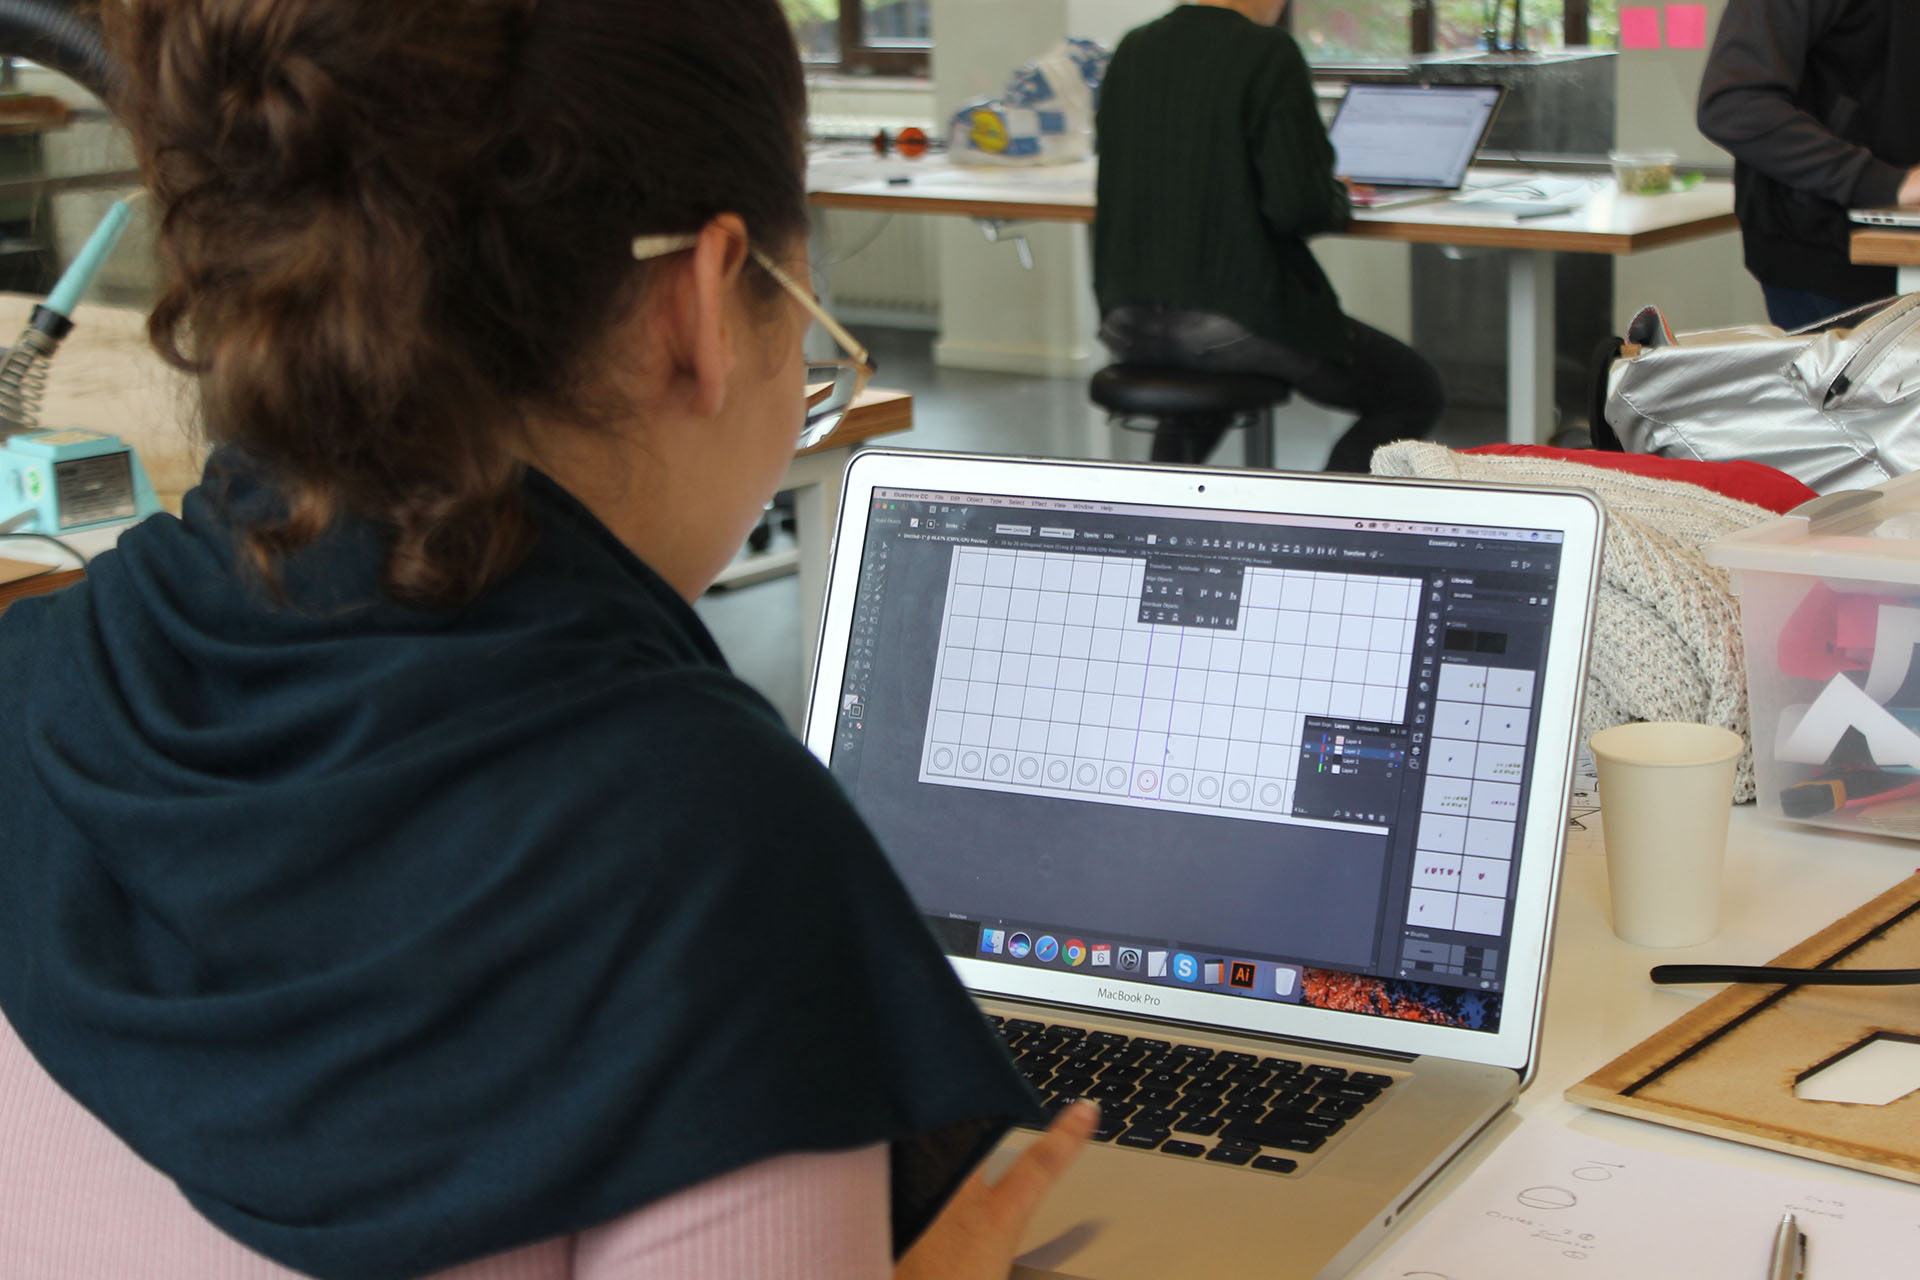
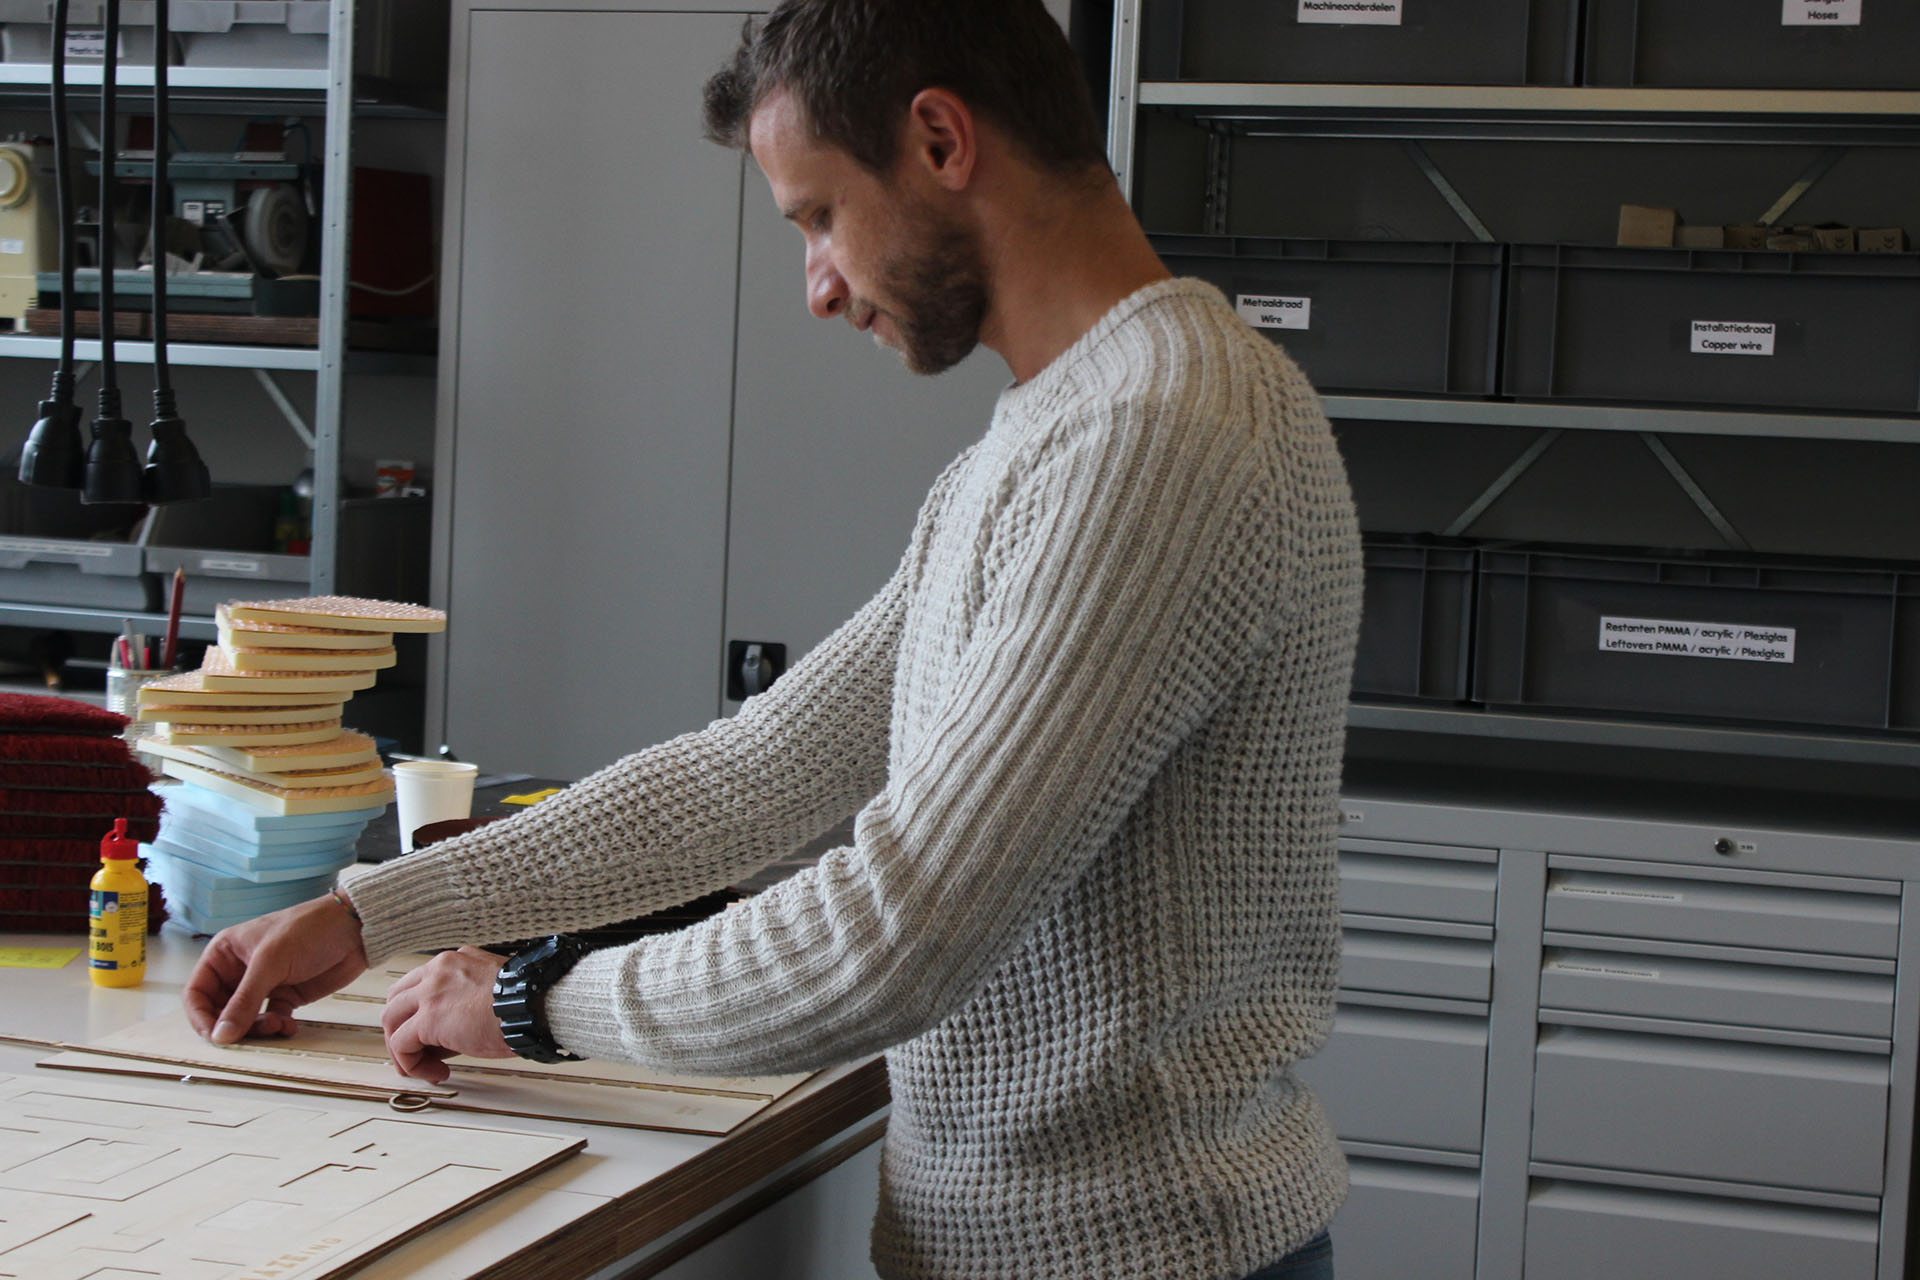
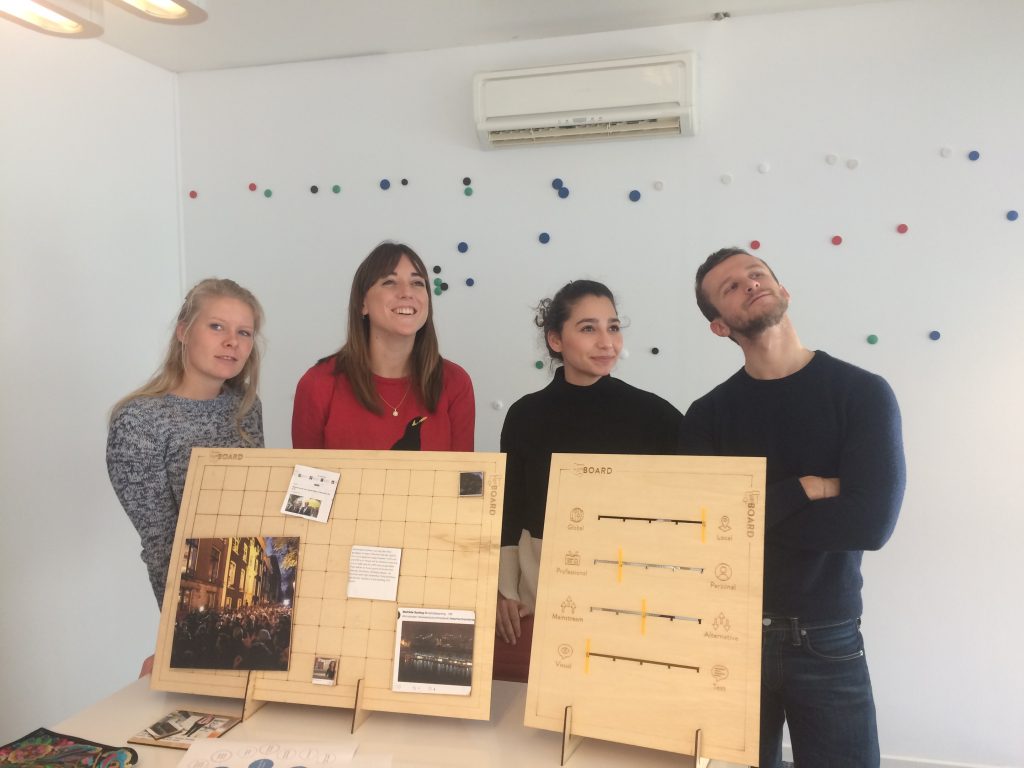
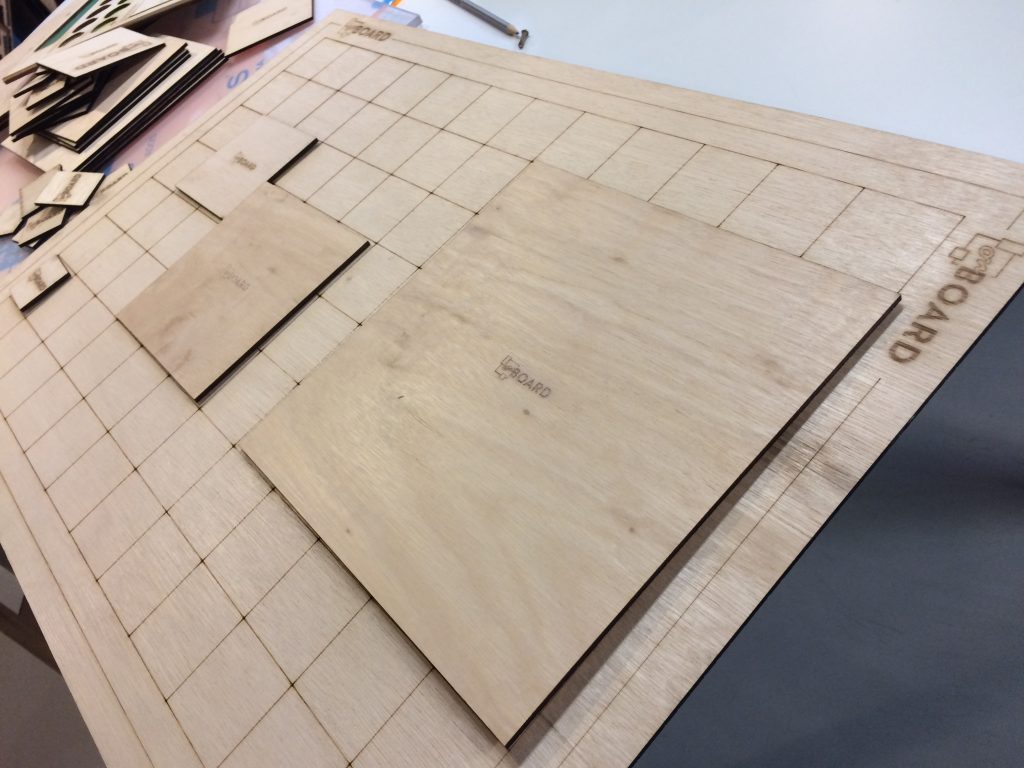
 Paper prototyping